Retail & venues / WORKED EXAMPLE
Apparel fitting & checkout
Find whether fitting rooms or checkout constrain a boutique visit.
Free to open, edit and save a file. Pro to run your changes. Opening a project asks before replacing your current space.
Where should we add service capacity before the next busy weekend?
- Who uses it
- Store managers and retail operations teams
- How it can create value
- Compare checkout-only, fitting-room-only and combined changes before committing staff or floor space. Weigh each wait reduction against its cost and your service target. Shorter waits alone do not establish extra sales.
- Bring your site data
- Arrivals by time of day, observed service times, available rooms and checkout positions, and the cost of each option. Sales claims also need observed abandonment and purchasing data.
01 / SETUP
A model you can inspect.
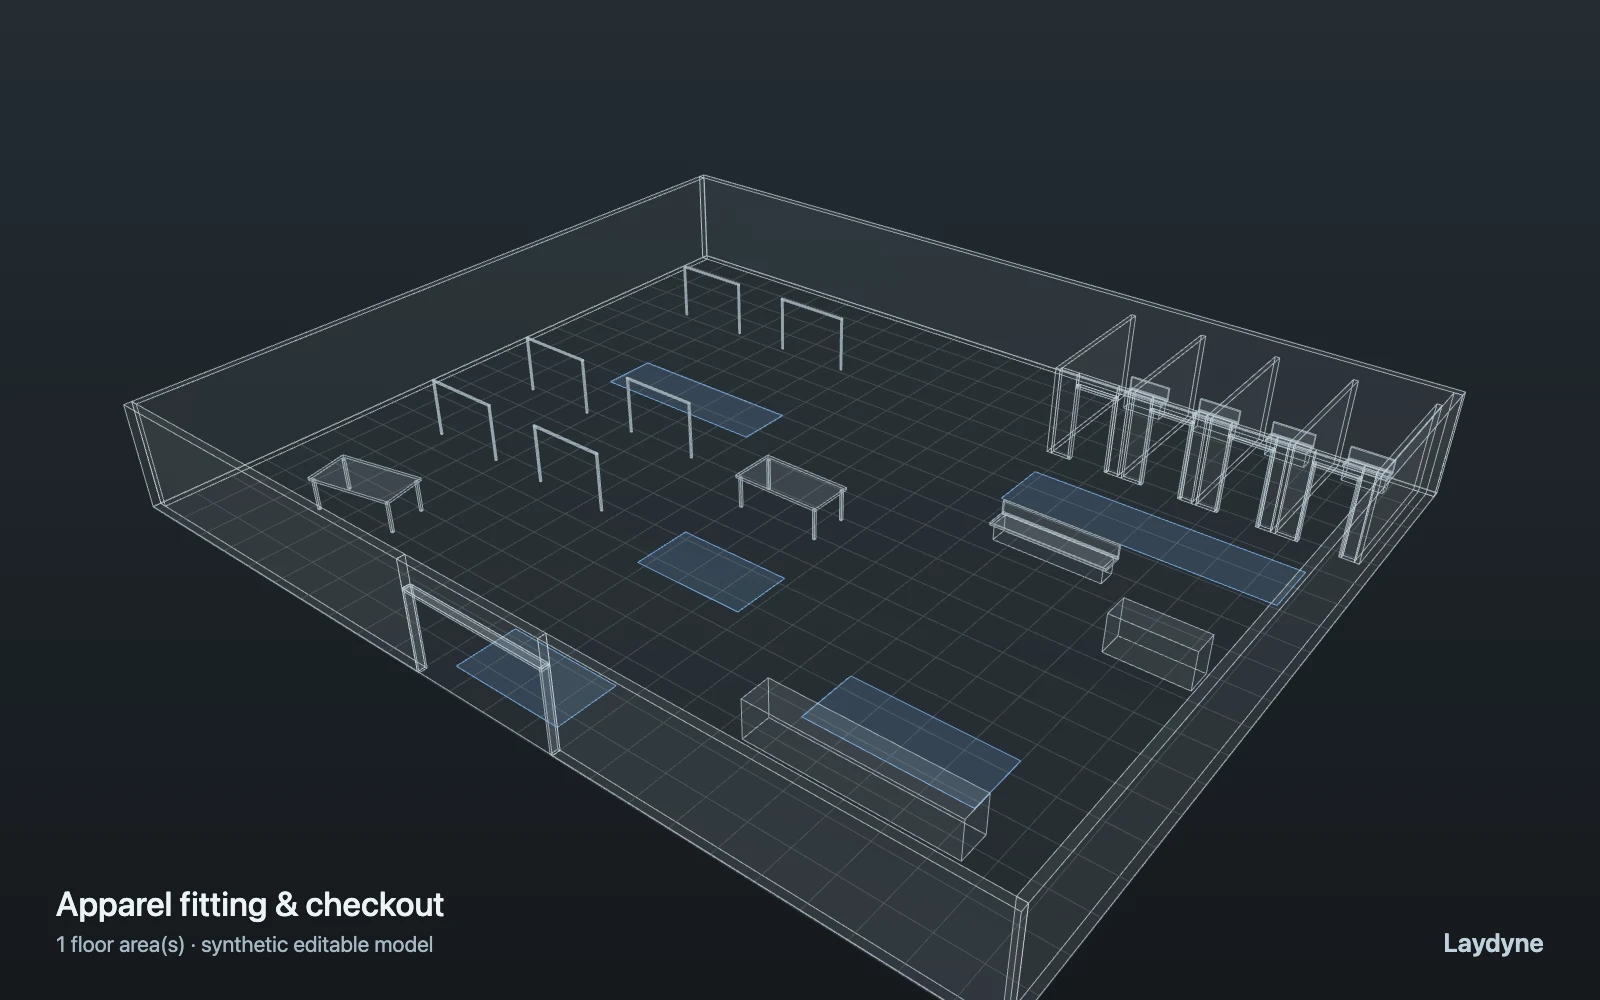
A synthetic boutique with 36 shoppers. Everyone browses, uses a fitting room and checks out in this controlled service-capacity example. Four booths and two checkout positions are drawn; compare how many are open. Waiting is a count and time at reception, not a physical queue or movement inside a booth. It does not predict browsing choices, conversion, sales, crowd safety or accessibility compliance.
Change one thing
Compare 2 and 4 open fitting rooms, then 1 and 2 checkout positions, with the same 36 shoppers.
Read the consequence
Mean wait, each service queue and visit time. Every shopper follows the same assumed journey; sales and physical crowding are not predicted.
View the starting inputs
- Shoppers
- 36
- Arrival interval (s)
- 30
- Open fitting rooms
- 2
- Open checkout positions
- 1
- Browsing time (s)
- 120
- Fitting-room use (s)
- 180
- Checkout service (s)
- 75
Agent counts, routes and resource definitions are also saved in the project JSON.
02 / ACTUAL ENGINE OUTPUT
The same demand. A different capacity.
One run, seed 0. Observation window 120 minutes. Arrivals, geometry and the seed set stay the same in every option.
| Scenario | Completed | Mean wait | Mean cycle | Blocked |
|---|---|---|---|---|
| 2 fitting rooms · 1 checkout | 36 | 17m 23s | 24m 16s | 0 |
| 2 fitting rooms · 2 checkouts | 36 | 17m 00s | 23m 54s | 0 |
| 4 fitting rooms · 1 checkout | 36 | 13m 08s | 20m 01s | 0 |
| 4 fitting rooms · 2 checkouts | 36 | 4m 08s | 11m 01s | 0 |
What changes the decision: adding a checkout alone saves 22.5 seconds of mean wait. Opening two more fitting rooms alone saves 4m 15s. Only the combined option meets an illustrative five-minute mean-wait target here. Compare the cost and feasibility of opening those positions; this sample does not price them.
Waiting averages cover arrived jobs, including unfinished waits; cycle averages cover completed jobs only. These are synthetic calculations, not measured store performance, revenue or a safety assessment.
Engine, status and output notes
process-des-2.2.0. Status: 2 fitting rooms · 1 checkout: completed; 2 fitting rooms · 2 checkouts: completed; 4 fitting rooms · 1 checkout: completed; 4 fitting rooms · 2 checkouts: completed. “Completed” is the engine run status; check the blocked column for unreachable jobs.
- No engine warnings.
Engine inputs and saved comparisons stay with the downloaded project. Any limited trace affects playback details, not aggregate metrics.
03 / MAKE IT YOURS
Plan in 2D. Inspect in 3D. Keep the whole project.
- Open and adjust. Switch between 2D and 3D; edit a part, a floor or an input. Both views describe the same model.
- Connect your agent for free. Sign in, choose Connect AI and connect Codex or Claude Code. Ask it to inspect the example, edit the layout and check a route.
- Save a checkpoint. Export → Project JSON, or ask the agent to export the complete project. Import it later to restore floors, scenarios, saved comparisons and the selected view.
- Compare with Pro. Run an edited scenario or compare frozen options under the same demand. Pro also adds built-in AI and manual cloud saving.