Retail & venues / WORKED EXAMPLE
Venue registration
Track exhibition visitors from registration to a booth, session and exit.
Free to open, edit and save a file. Pro to run your changes. Opening a project asks before replacing your current space.
How much registration capacity is needed before the opening session?
- Who uses it
- Event producers and venue operations teams
- How it can create value
- Compare arrival peaks and registration desks before booking staff and equipment. Look for a plan that meets the chosen wait target without unnecessary service positions; validate it at the venue.
- Bring your site data
- Expected arrival profile, measured check-in time, available desks and acceptable wait. This is service-capacity planning, not crowd safety or evacuation analysis.
01 / SETUP
A model you can inspect.
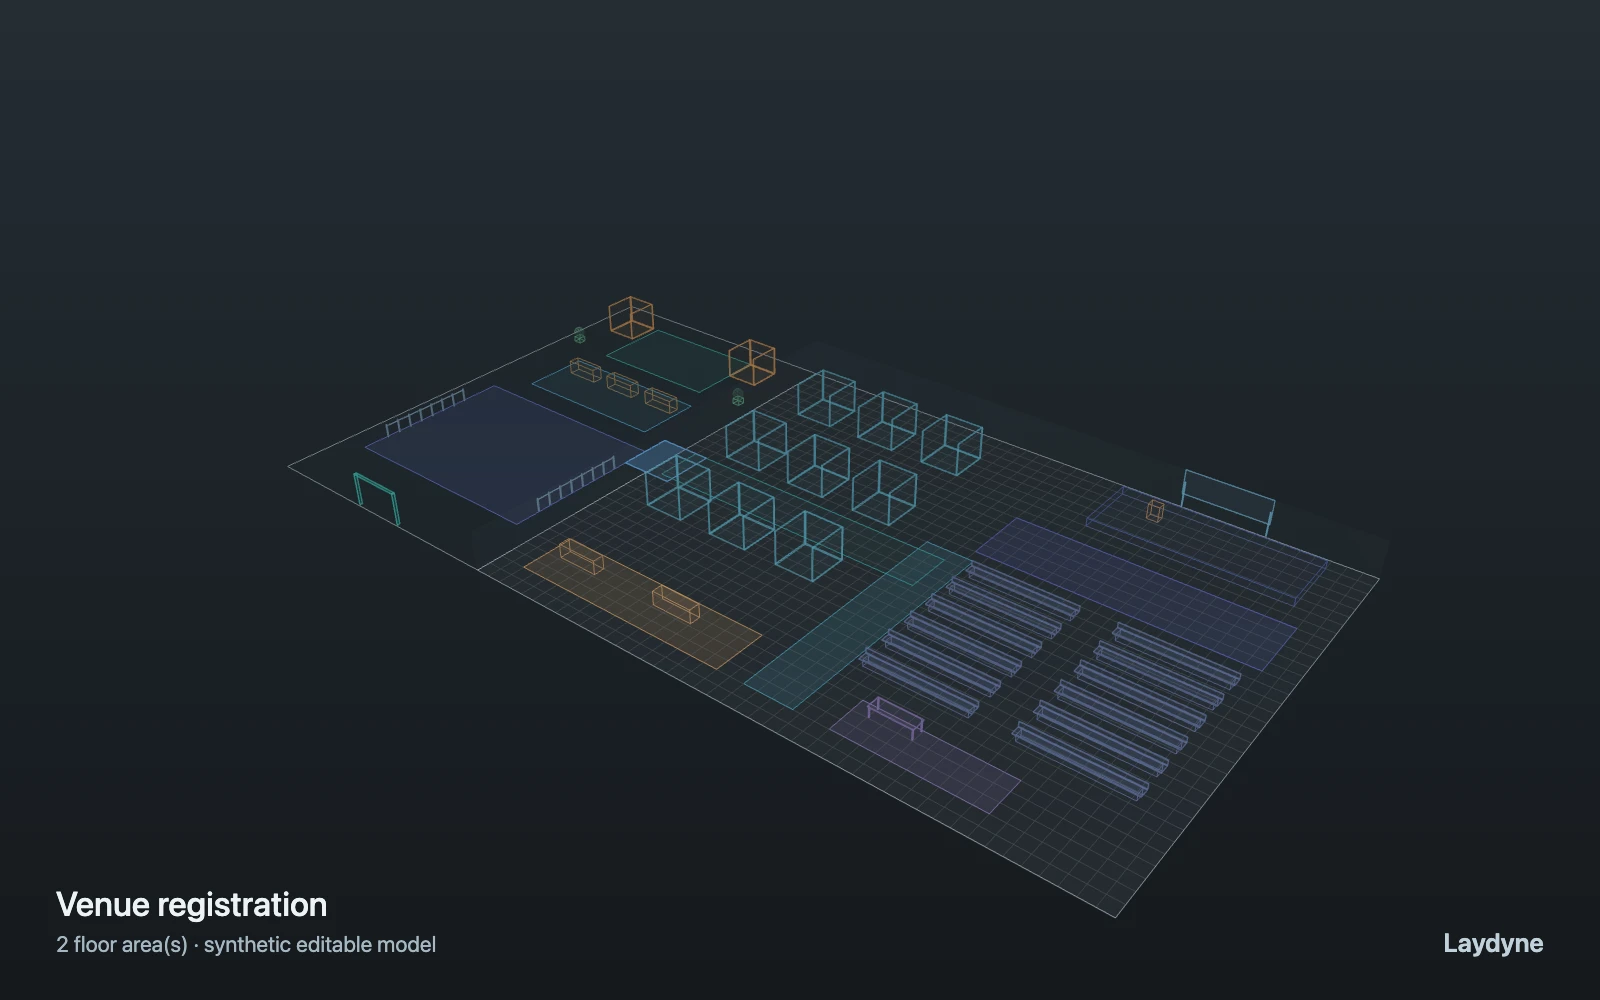
Synthetic exhibition: visitors register, visit a booth, attend a session and leave. Change desk and seat capacities or move the registration area, then compare with the same arrivals. Capacity fields do not add physical counters or seats; edit those parts separately. Test another arrival rate separately. Queues are counts and waits, not physical queue length, crowd movement or an evacuation assessment.
Change one thing
Add registration desks or session capacity with the same arrivals.
Read the consequence
Registration wait, seat occupancy and completed visits.
View the starting inputs
- Registration desks
- 3
- Session seats
- 60
- Visitors per hour
- 300
Agent counts, routes and resource definitions are also saved in the project JSON.
02 / ACTUAL ENGINE OUTPUT
A reproducible starting result.
Means across 3 runs, seeds 41–43. Observation window 120 minutes.
| Scenario | Completed | Mean wait | Mean cycle | Blocked |
|---|---|---|---|---|
| Original scenario | 273.3 | 4m 25s | 14m 44s | 0 |
Waiting averages cover arrived jobs, including unfinished waits; cycle averages cover completed jobs only. These are synthetic calculations, not measured store performance, revenue or a safety assessment.
Engine, status and output notes
process-des-2.2.0. Status: Original scenario: completed. “Completed” is the engine run status; check the blocked column for unreachable jobs.
- Timeline output is limited to 200 jobs and 500 entries. Aggregate metrics include all jobs.
Engine inputs and saved comparisons stay with the downloaded project. Any limited trace affects playback details, not aggregate metrics.
03 / MAKE IT YOURS
Plan in 2D. Inspect in 3D. Keep the whole project.
- Open and adjust. Switch between 2D and 3D; edit a part, a floor or an input. Both views describe the same model.
- Connect your agent for free. Sign in, choose Connect AI and connect Codex or Claude Code. Ask it to inspect the example, edit the layout and check a route.
- Save a checkpoint. Export → Project JSON, or ask the agent to export the complete project. Import it later to restore floors, scenarios, saved comparisons and the selected view.
- Compare with Pro. Run an edited scenario or compare frozen options under the same demand. Pro also adds built-in AI and manual cloud saving.