Serving robots at the dinner peak
See how many serving robots a family restaurant needs at the dinner peak, and how much carrying they take off the floor staff.
No sign-in needed: open it in Studio, inspect the saved results and edit in 2D and 3D. Sign in to connect your own AI; project files remain free. Check Account for execution access. Opening asks before replacing your current space.
How many serving robots does this store need at the dinner peak, and does the table layout leave them room?
- Who uses it
- Restaurant chain operations teams and store managers
- How it can create value
- Large Japanese chains now run one or two serving robots per restaurant and three in large ones. Before ordering robots for a store, compare counts against an extra server on the same evening: plates waiting at the pass, carrying left to the floor team, and robot use. Check that every robot lane in the plan stays clear (here at least 1.2 m between seats; a robot needs about 0.7 m). Weigh the results against lease and labour costs; less walking frees staff time but cuts payroll only if hours change.
- Bring your site data
- The store’s plan with its aisles, parties and party sizes per half hour, kitchen and eating times from the POS, robot speed and loading time, and the floor team’s other work. Robot traffic, collisions and guests’ reactions need observation before trusting short waits.
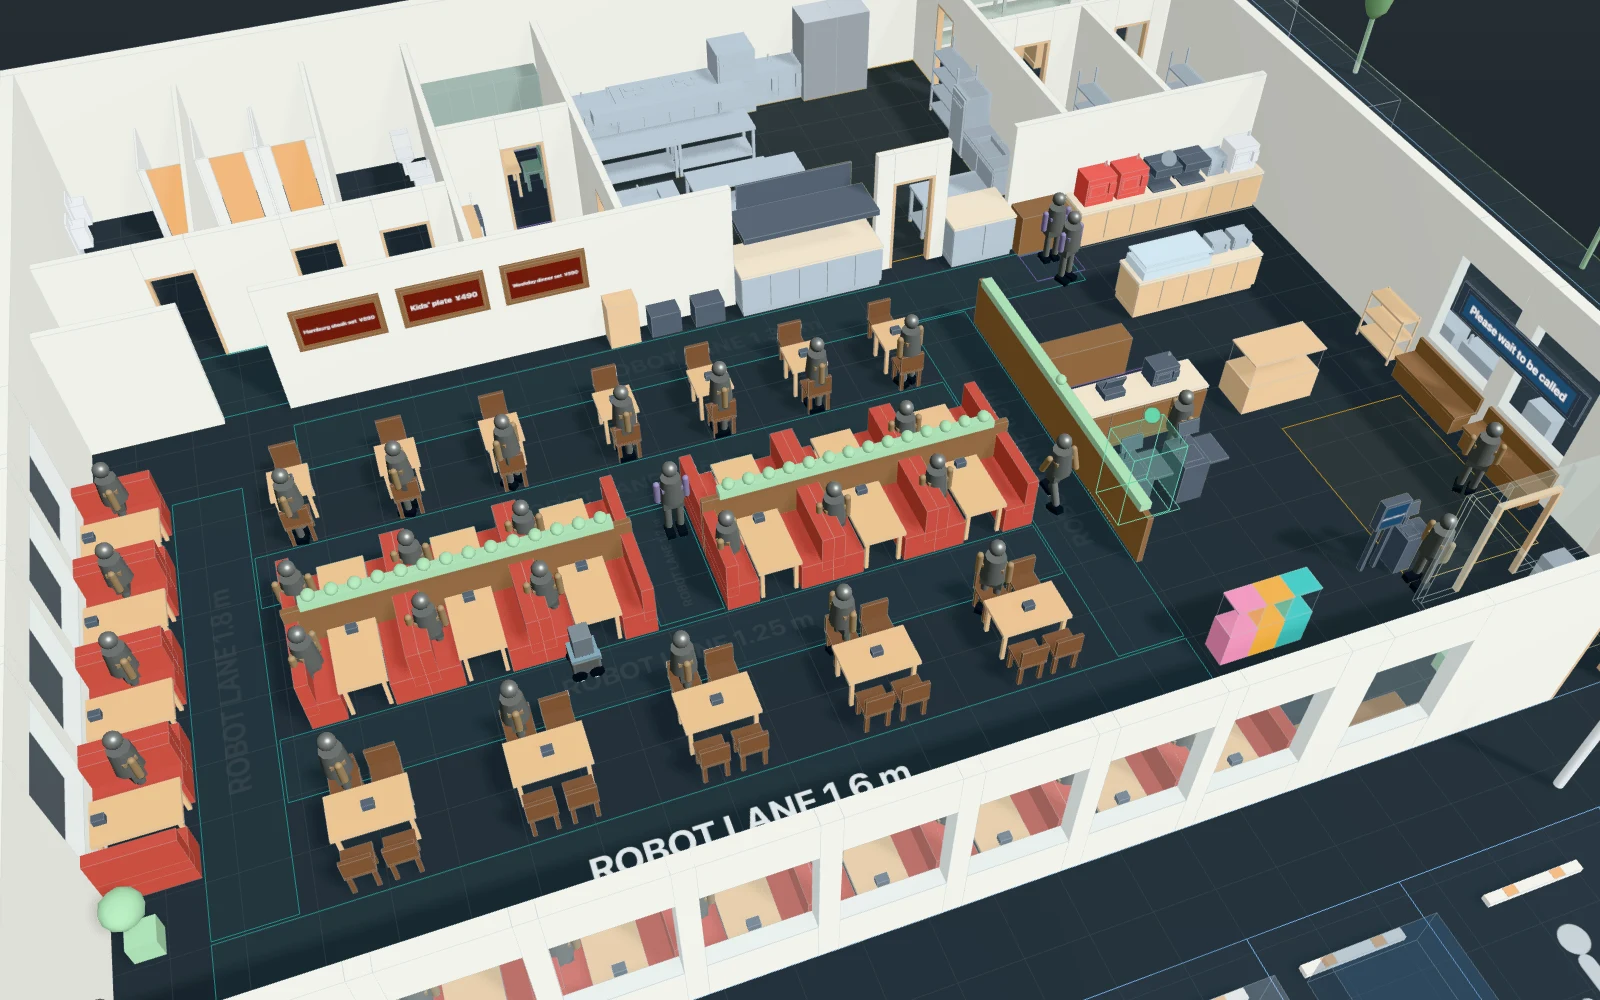
A model you can inspect.
A weekday dinner, 17:30 to 22:00, in a 134-seat roadside family restaurant. 73 parties drive in at fixed times drawn once from a dinner pattern (14 parties an hour at 17:30, 36 from 18:30 to 19:30), take a ticket at the reception terminal and wait to be seated: one in five at a two-seat table, the rest at a booth or four-seat table, in turn as tables are reset. They order on the table's tablet, half fetch a drink, and after the kitchen's time (a random 5 to 13 minutes) the plates are on the pass. A serving robot (0.6 m/s, one tray load per table) is loaded there, drives to the table and waits while the guests lift the plates off; plates that have waited a minute for a robot are run by a floor server instead. After the meal a robot, or after three minutes a server, takes the used dishes to the dish return; the party lingers, pays at one of two self-checkouts and leaves, and a server wipes and resets the table. Each party is drawn as one guest, and the plates, used dishes and reset are tasks that meet it at its table. Cooks, call buttons, water and take-out are not modelled, so the servers' walking is a lower bound; robots and people pass through each other (no collision avoidance or robot traffic), and nothing here predicts sales or guest satisfaction.
Change one thing
With the same 73 parties, compare 1, 2 and 3 robots, then keep 1 robot and add a fourth server. Change how long plates wait for a robot (passWaitSeconds), or move the robot chargers or a row of tables and run again.
Read the consequence
Plates from the pass to the table (the serve time), how many plates and used dishes the servers had to carry, the servers’ and robots’ walking, and the robots’ use. Shares of drinks, kitchen times and eating times are assumptions; sales and guest satisfaction are not modelled.
View the starting inputs
- Serving robots
- 1
- Floor staff
- 3
- Longest wait for a robot before a server runs the plates (s)
- 60
- Longest wait for a robot before a server clears (s)
- 180
Agent counts, routes and resource definitions are also saved in the project JSON.
The same demand. A different capacity.
One run, seed 7. Observation window 270 minutes. Arrivals, geometry and the seed set stay the same in every option.
| Scenario | Completed | Mean wait | Mean cycle | Blocked |
|---|---|---|---|---|
| 1 robot · 3 floor staff | 292 | 30m 52s | 44m 14s | 0 |
| 2 robots · 3 floor staff | 292 | 29m 25s | 42m 53s | 0 |
| 3 robots · 3 floor staff | 292 | 28m 46s | 42m 15s | 0 |
| 1 robot · 4 floor staff | 292 | 30m 48s | 44m 11s | 0 |
Waiting averages cover arrived jobs, including unfinished waits; cycle averages cover completed jobs only. These are synthetic calculations, not measured site performance, revenue or a safety assessment.
Engine, status and output notes
process-des-2.7.0. Status: 1 robot · 3 floor staff: completed; 2 robots · 3 floor staff: completed; 3 robots · 3 floor staff: completed; 1 robot · 4 floor staff: completed. “Completed” is the engine run status, not success for every job. Check blocked jobs and warnings.
- No engine warnings.
Engine inputs and saved comparisons stay with the saved project. Any limited trace affects playback details, not aggregate metrics.
Plan in 2D. Inspect in 3D. Keep the whole project.
- Open and adjust. Switch between 2D and 3D; edit a part, a floor or an input. Both views describe the same model.
- Connect your agent for free. Sign in, choose Connect AI and connect ChatGPT, Claude, Codex or Claude Code. Ask it to inspect the example, edit the layout and check a route.
- Save a checkpoint. Project → Project file, or ask the agent to export the complete project. Import it later to restore floors, scenarios, saved comparisons and the selected view.
- Compare options. Run new operational comparisons under the same demand. Check Account for execution access, built-in AI and manual cloud-saving limits.