Moving-season Monday at the ward office
See how the moving-season queue builds at a ward office, and what more counters or pre-filled forms change.
No sign-in needed: open it in Studio, inspect the saved results and edit in 2D and 3D. Sign in to connect your own AI; project files remain free. Check Account for execution access. Opening asks before replacing your current space.
For the March–April peak, should we open more counters or shorten each visit with pre-filled forms, and which counter becomes the bottleneck next?
- Who uses it
- Ward office citizen-services managers planning the moving season, and the staff who explain it to the council and residents
- How it can create value
- Compare extra counters with shorter service before fixing the busy-season staffing and the budget request, and show the council and residents the expected waits of each option. The modeled waits are a planning comparison, not a promise: weigh each option against the staff hours and temporary staff it needs.
- Bring your site data
- Last year's ticket-machine log by purpose and quarter hour, measured counter times by procedure (moving in, out and within the ward, health insurance, certificates), the share sent on to other counters, and how many counters can be staffed. Online and postal applications, residents who give up and staff breaks need their own data and are not modelled.
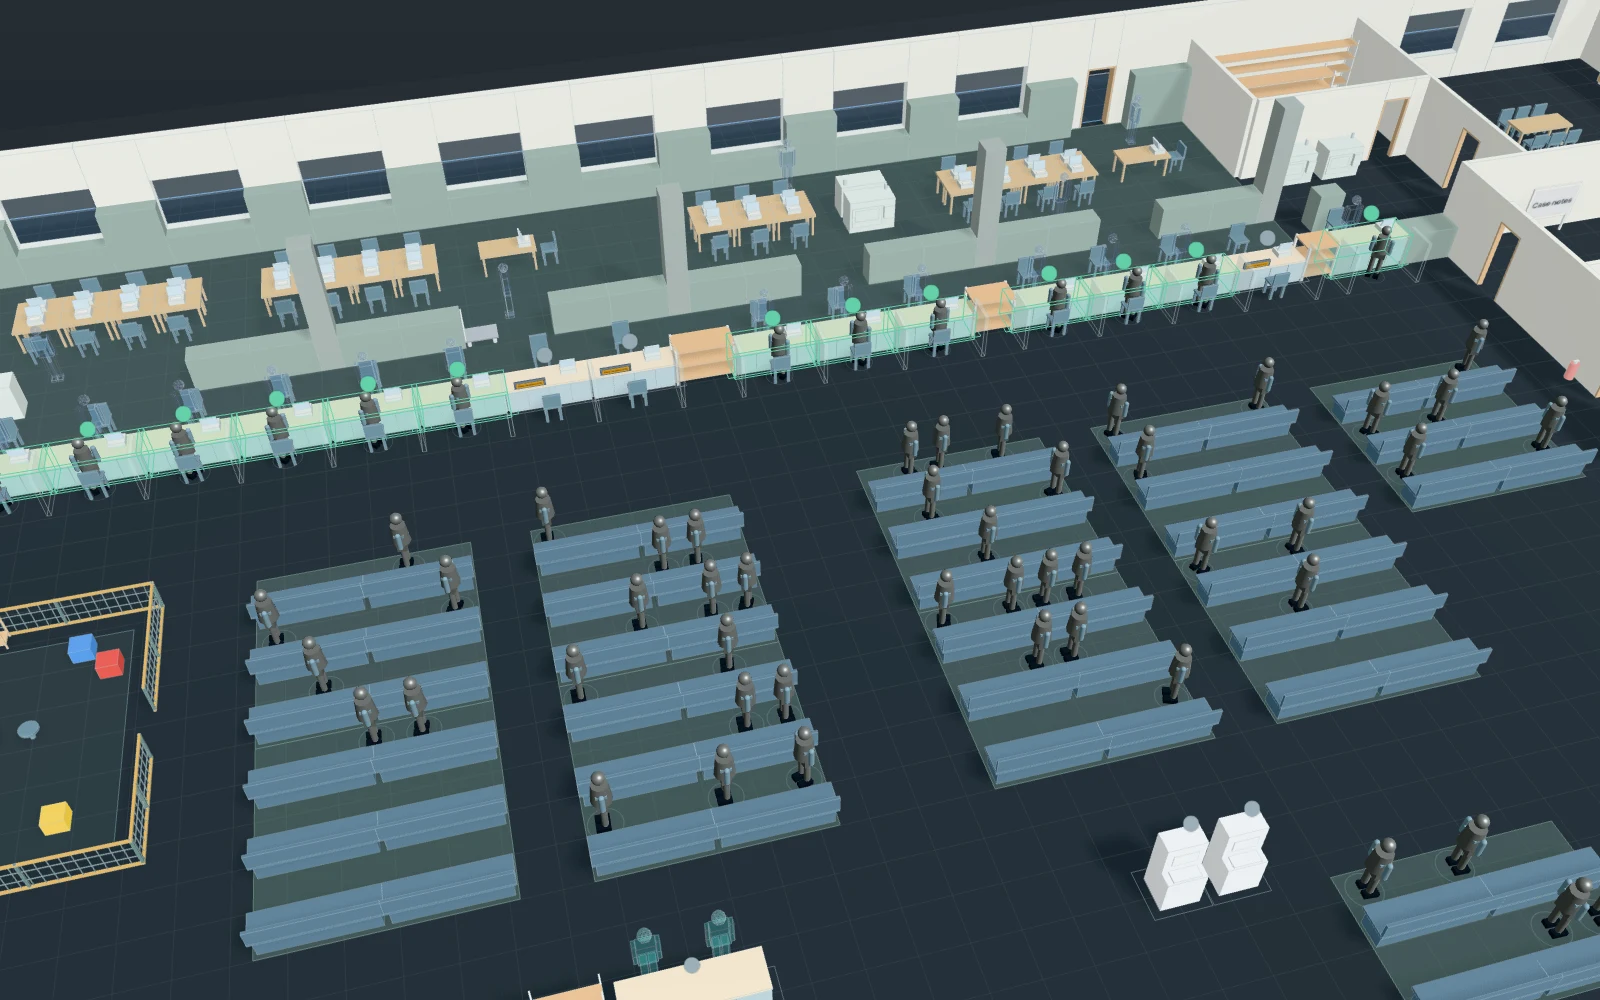
A model you can inspect.
The residents' service floor of a ward office on a Monday morning in the March–April moving season. Twenty residents wait at the doors when they open at 8:30; then about 70 an hour (more from 9:00 to 10:00) arrive for three hours from the bus stop, the pavements, the bicycle park and the accessible parking. About a third ask the floor guide first. Those moving in, out or within the ward fill in the form at a writing table, certificate seekers a request form; everyone takes a numbered ticket and sits down until the number is called to a free counter for their purpose: moving in/out (1–8), certificates (9–11) or National Health Insurance (12–15), one line of numbers per purpose, first come, first served. After a moving registration 35% are sent on to health insurance and 20% for a certificate; certificates are printed in the back office while the resident waits, then paid for and collected at the cashier (16). The 13-counter baseline leaves the busy-season counters 7, 8 and 15 closed. Public examples of the decision: one Tokyo ward opened 16 reception counters instead of 13 for the busy season; a city ward reported average waits falling from 141 to 42 minutes after changing its procedures. Service times are assumed distributions, not measurements; staff are counted as open counters. Walking, numbered waits and service only: no crowd physics, no residents who give up and come back another day, no online or postal procedures, no staff breaks.
Change one thing
With the same residents and seed, open 16 counters instead of 13 (moving in/out 6 → 8, health insurance 3 → 4), or keep 13 and cut the mean moving in/out time from 13 to 9 minutes with pre-filled forms.
Read the consequence
Average and longest wait per resident, the numbers waiting for each purpose, how busy each counter is and the time in the building. Watch whether faster moving counters only move the queue on to health insurance. Crowding, residents who give up and staff breaks are not modelled.
View the starting inputs
- Residents arriving per hour (9:00–10:00 is 15% busier)
- 70
- Moving in/out counters open (up to 8)
- 6
- Certificate counters open (up to 3)
- 3
- Health insurance counters open (up to 4)
- 3
- Mean time at a moving in/out counter (min)
- 13
- Mean time filling in the moving form (min)
- 4
Agent counts, routes and resource definitions are also saved in the project JSON.
The same demand. A different capacity.
One run, seed 31. Observation window 330 minutes. Arrivals, geometry and the seed set stay the same in every option.
| Scenario | Completed | Mean wait | Mean cycle | Blocked |
|---|---|---|---|---|
| 13 counters | 226 | 28m 52s | 50m 15s | 0 |
| 16 counters (+2 moving in/out, +1 health insurance) | 226 | 12m 10s | 33m 33s | 0 |
| 13 counters + pre-filled forms (form 4 → 1 min, counter 13 → 9 min) | 226 | 14m 20s | 32m 10s | 0 |
Waiting averages cover arrived jobs, including unfinished waits; cycle averages cover completed jobs only. These are synthetic calculations, not measured site performance, revenue or a safety assessment.
Engine, status and output notes
process-des-2.7.0. Status: 13 counters: completed; 16 counters (+2 moving in/out, +1 health insurance): completed; 13 counters + pre-filled forms (form 4 → 1 min, counter 13 → 9 min): completed. “Completed” is the engine run status, not success for every job. Check blocked jobs and warnings.
- No engine warnings.
Engine inputs and saved comparisons stay with the saved project. Any limited trace affects playback details, not aggregate metrics.
Plan in 2D. Inspect in 3D. Keep the whole project.
- Open and adjust. Switch between 2D and 3D; edit a part, a floor or an input. Both views describe the same model.
- Connect your agent for free. Sign in, choose Connect AI and connect ChatGPT, Claude, Codex or Claude Code. Ask it to inspect the example, edit the layout and check a route.
- Save a checkpoint. Project → Project file, or ask the agent to export the complete project. Import it later to restore floors, scenarios, saved comparisons and the selected view.
- Compare options. Run new operational comparisons under the same demand. Check Account for execution access, built-in AI and manual cloud-saving limits.