Ask AI to model your venue’s arrival and check-in flow
Describe your entrances, registration desks, and visitor journey to AI. It can build the layout and connect arrival patterns to service steps. Then ask what changes with another desk or a busier arrival period, and compare the modelled queues under explicit assumptions.
How much registration capacity is needed before the opening session?
- Who uses it
- Event producers and venue operations teams
- How it can create value
- Compare arrival peaks and registration desks before booking staff and equipment. Look for a plan that meets the chosen wait target without unnecessary service positions; validate it at the venue.
- Bring your site data
- Expected arrival profile, measured check-in time, available desks and acceptable wait. This is service-capacity planning, not crowd safety or evacuation analysis.
Start with this conversation.
Example requests for your MCP agent or the built-in Pro assistant. Review the inputs before running a simulation.
Build the model
Open the venue flow example and explain the route from arrival through registration to the exhibition. Show the arrival rate, registration time, and desk capacity for me to confirm.
Compare with Pro
Compare three registration desks with four. Keep the arrivals, observation window, and seeds identical. Show average wait, peak registration queue, and completed visits.
Adapt the workflow
Add a badge pickup step after registration with its own staff capacity. Ask me for the pickup time and staff count, then prepare that workflow.
MCP editing and scenario preparation are free with an account. Simulation and comparisons require Pro; see Account for current pricing and availability. These are suggested requests, not a recorded AI session.
What this synthetic example produced
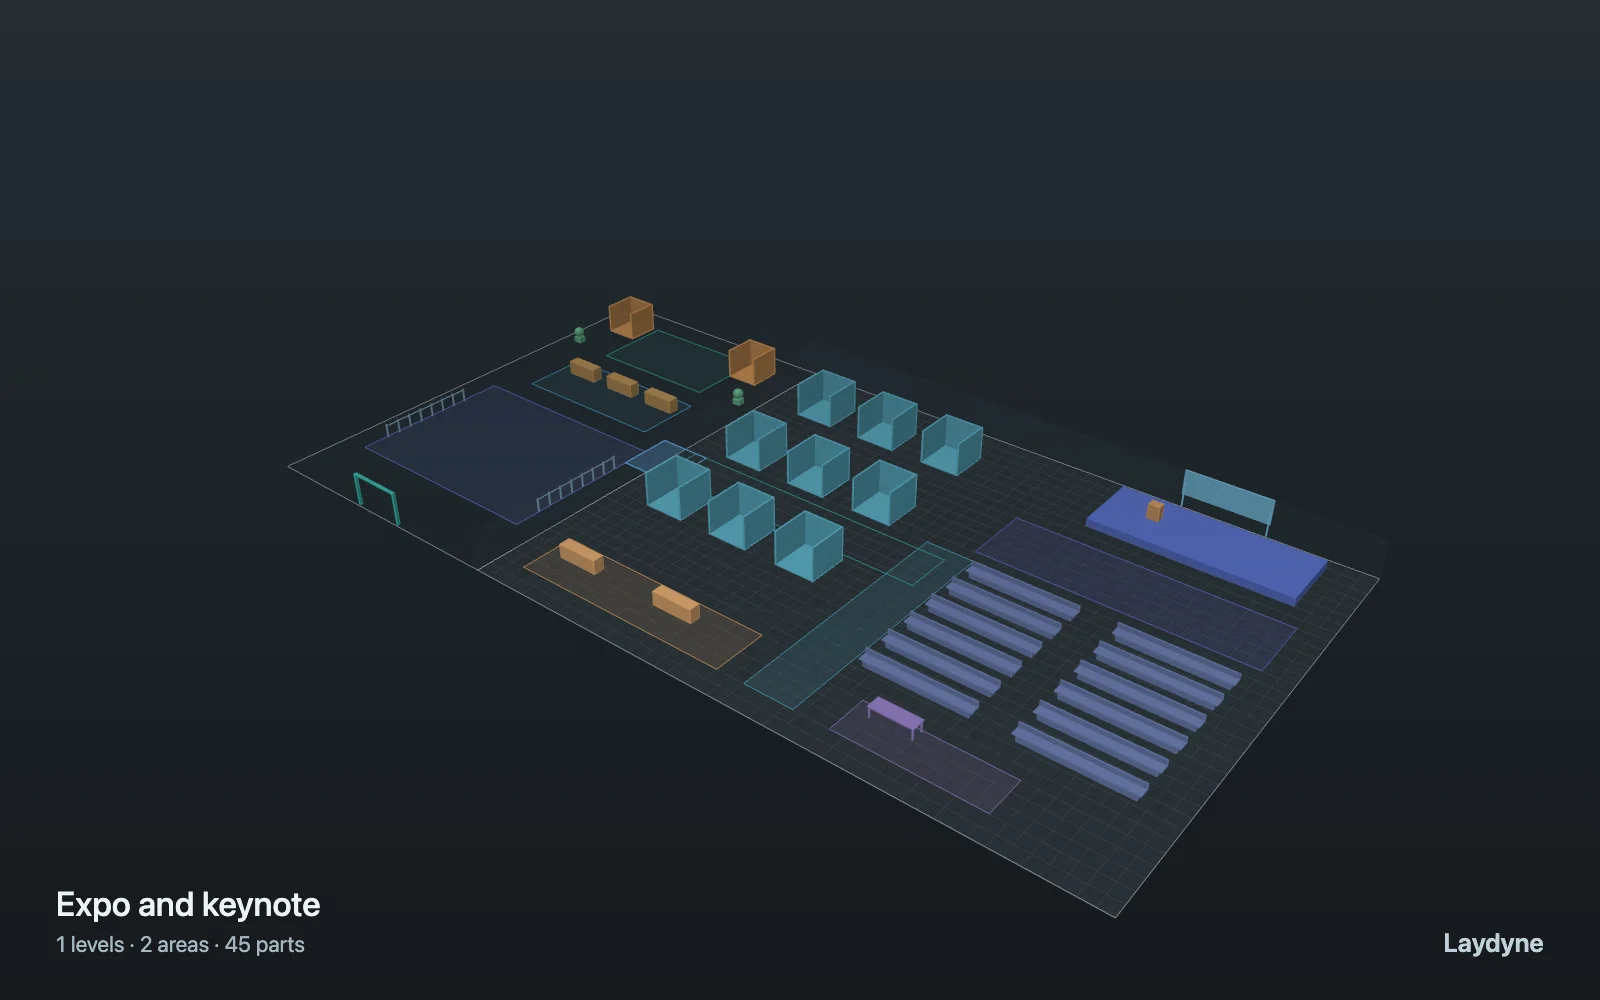
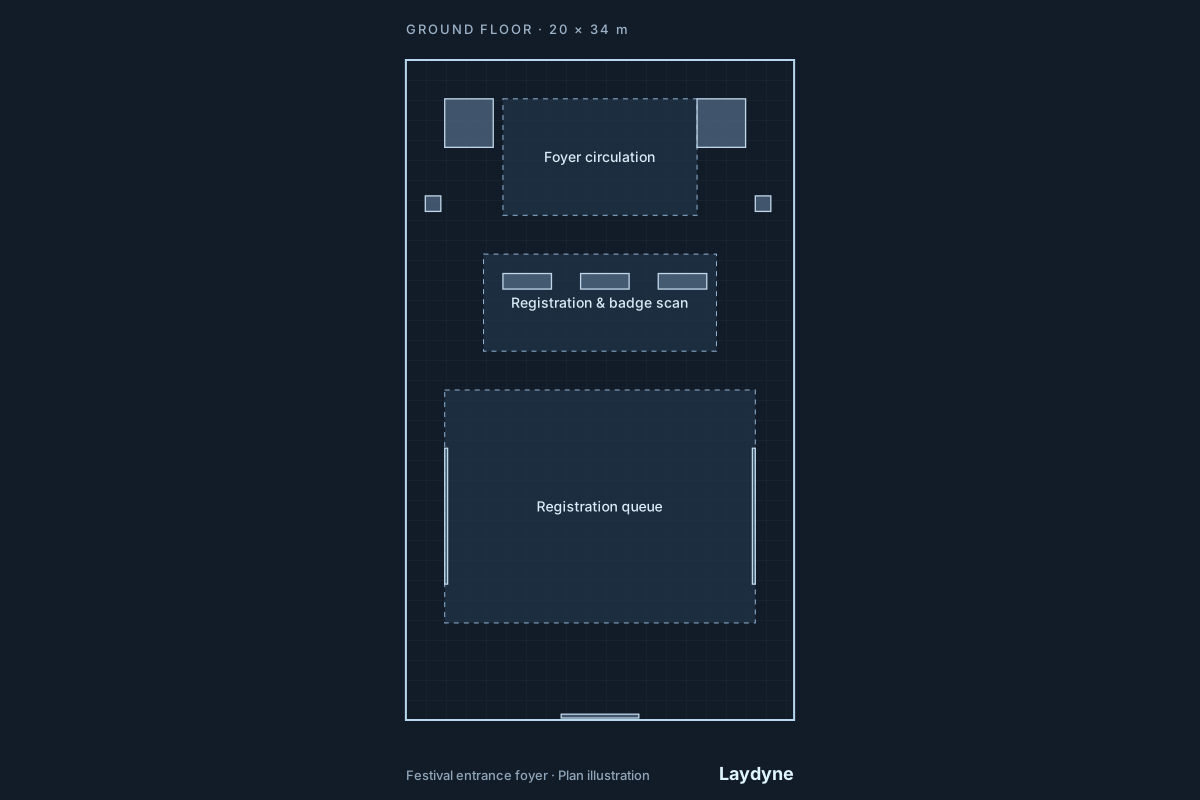
A synthetic exhibition has registration, booths, a keynote area, and a connection between two floor areas. Visitors arrive as a Poisson stream averaging 300 per hour for one hour, and the model runs for two hours. The comparison changes registration capacity from three desks to four, keeping the other inputs and seeds 41–43 the same.
| Variant | Mean wait per visitor | Mean completed visits |
|---|---|---|
| 3 registration desks | 4m 25s | 273.3 |
| 4 registration desks | 15s | 273.3 |
The fourth desk reduces modelled waiting and the peak registration queue. It does not increase completed visits in this two-hour window. That distinction matters when the goal is visitor experience rather than throughput.
The space and scenario were built through WebMCP. The exported project was evaluated with the same local process-des-2.1.1 engine because the local test account had no simulation access. A paid MCP simulation was not run.
Download the example project (JSON)Open the complete worked project
View the 2D/3D model, recorded simulation and project file →
Give AI the inputs that matter
The example contains a hall floor, booths, entrance and destination zones, and routes through the space. These are planning abstractions: booth shapes and capacities represent assumptions to verify against the actual venue.
- Sketch the hall boundary, obstacles, open corridors, entrances, and zones on a dimensioned floor.
- Set arrival streams, branch choices, service durations, and capacities for checkpoints or destinations.
- Choose an observation window and seed so two candidate layouts can be rerun under comparable demand.
Ask AI to compare the options
- Run the baseline process scenario and inspect completed visits, waiting time, and resource or connection queues.
- Adjust the corridor or checkpoint capacity, layout, or assumed arrival rate. Rerun and inspect the changed bottleneck.
- Treat the result as a question for operators and venue measurements, especially where queues could affect safety.
Read the result
The model can report:
- Jobs or visits completed within the modelled time window.
- Average and maximum modelled waiting, including unfinished waits at the horizon.
- Queue and connection metrics that help identify capacity constraints.
The result helps compare explicit capacity assumptions. It cannot predict where a real crowd will stand or how dense a corridor will become. Validate arrivals, route choices, and operating rules with the venue before making decisions.
What this model does not establish
This is a count-and-capacity simulation, not crowd physics, emergency egress analysis, occupancy certification, or legal compliance. People do not collide or dynamically avoid each other; waiting agents do not occupy physical queue length.
Read the model and workflow manual before treating a result as evidence for a real site.