Expo opening morning
See which line sets the opening-morning wait: the walk-up counters, the QR kiosks or the bag check.
No sign-in needed: open it in Studio, inspect the saved results and edit in 2D and 3D. Sign in to connect your own AI; project files remain free. Check Account for execution access. Opening asks before replacing your current space.
How many staffed counters and kiosks does the opening morning need, and does pushing pre-registration do the same for less?
- Who uses it
- Show organisers and venue operations managers planning registration for each show
- How it can create value
- Before booking registration staff and renting kiosks for a show, compare counters, kiosks and the pre-registered share against the same arrival wave and see which line sets the longest wait. Weigh each wait reduction against staff hours, kiosk rental and the cost of pre-registration reminders; a shorter queue alone does not show more visitors or leads.
- Bring your site data
- Arrivals by time of day from past shows (gate counts or badge scans), the pre-registered share, measured registration and kiosk times, the counters you can staff and the kiosks you can rent. Real visitors balk, switch lines and bunch at the doors: check the line lengths against the first hour of a past show.
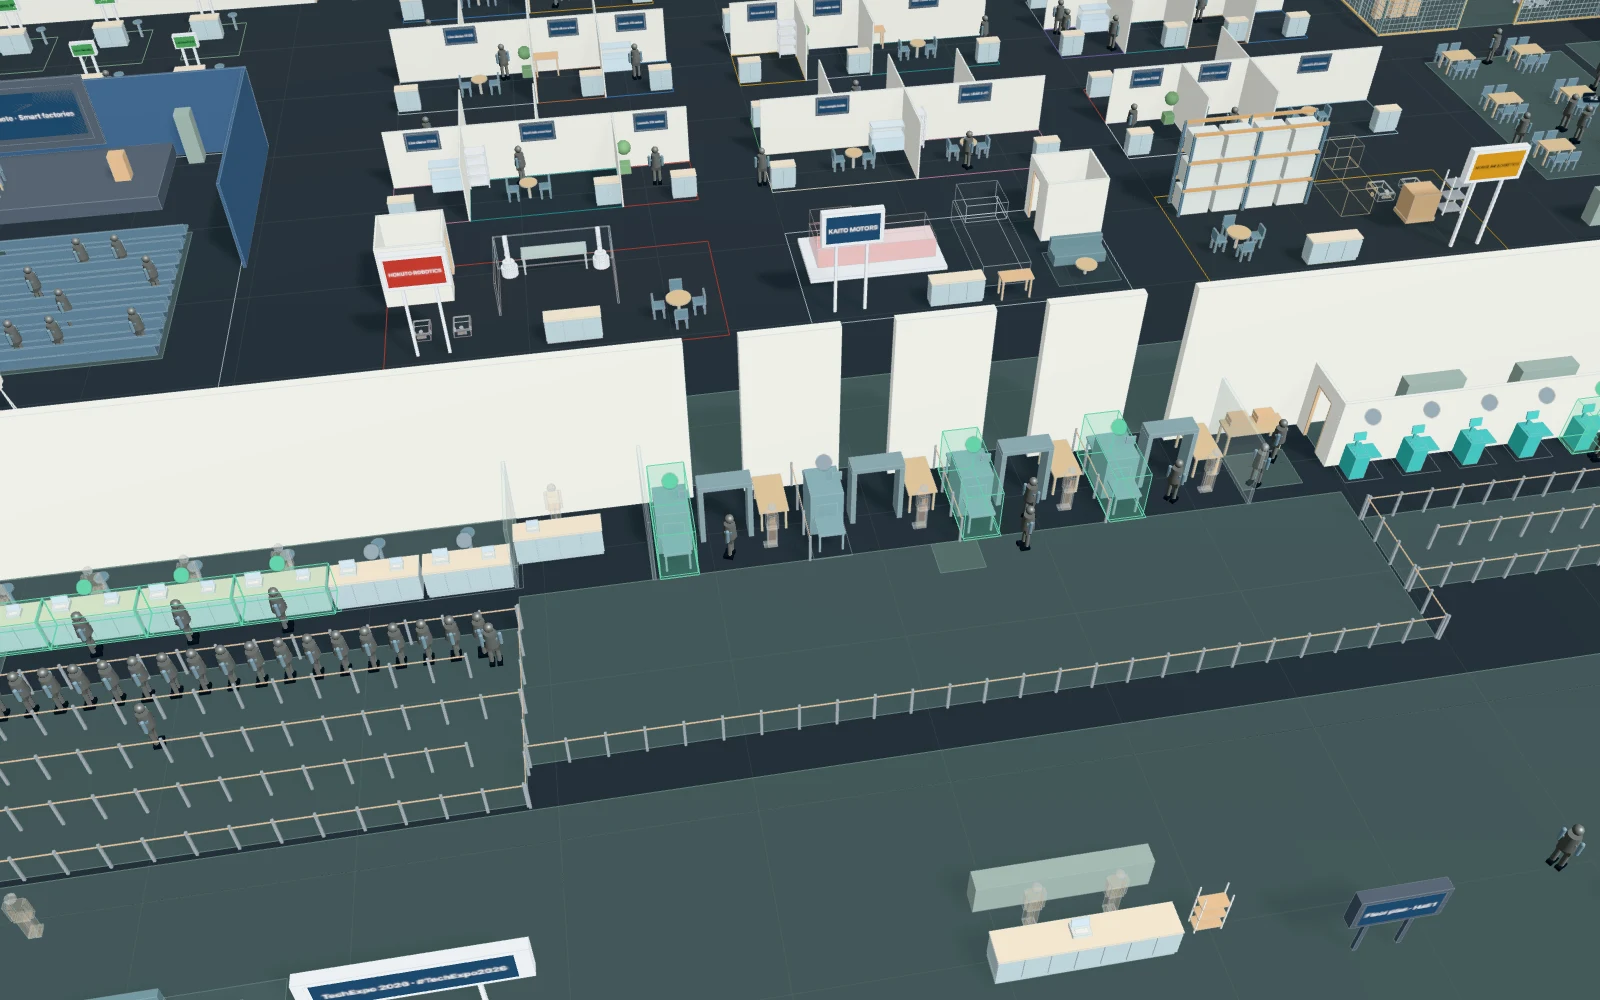
A model you can inspect.
A trade show opens at 09:00. Visitors arrive at the forecourt (station walkway, taxi rank, shuttle bus, car park) in a morning wave: poisson at a base rate of 200 an hour, ×1 for 10 min, ×2.5 for 15 min, ×1.5 for 15 min and ×0.6 for 10 min (241 visitors with seed 7). One in eight leaves a coat at the cloakroom. 70% are pre-registered and wait in one line for the open QR kiosks (scan and print 25–90 s), then take a lanyard; the rest wait in one serpentine for the staffed walk-up counters A–F (form, photo ID and badge 90–240 s, printing 10–20 s), each going to the next free open counter. Everyone then waits for a free open bag check lane (10–30 s) and enters Hall 1 to visit one to three stands (1–6 min each), sit in the 10:30 keynote or have a coffee first. The open counters, kiosks and lanes are the first ones of each kind; all the parts stay in the model. Walking, service times and first-come lines only: no crowd physics, balking or line switching, no seat limit at the keynote, and no visitor numbers, leads or sales.
Change one thing
With the same visitors, open 6 counters instead of 4, switch on all 8 kiosks, raise the pre-registered share from 70% to 85% (with 4 or 8 kiosks), or open fewer bag check lanes.
Read the consequence
The walk-up, QR and bag check lines, the mean and the longest wait. Watch whether a change shortens the queue or only moves it: 85% pre-registered with 4 kiosks moves it from the counters to the kiosks. Crowd density, egress and fire safety are not modelled.
View the starting inputs
- Visitors per hour (base of the morning wave)
- 200
- Pre-registered with a QR code (%; the rest walk up)
- 70
- Staffed walk-up counters open (1–6)
- 4
- QR kiosks switched on (1–8)
- 4
- Open bag check lanes (1–4)
- 4
Agent counts, routes and resource definitions are also saved in the project JSON.
The same demand. A different capacity.
One run, seed 7. Observation window 120 minutes. Arrivals, geometry and the seed set stay the same in every option.
| Scenario | Completed | Mean wait | Mean cycle | Blocked |
|---|---|---|---|---|
| 4 staffed counters · 4 kiosks | 241 | 3m 20s | 16m 59s | 0 |
| 6 staffed counters · 4 kiosks | 241 | 1m 08s | 14m 47s | 0 |
| 4 staffed counters · 8 kiosks | 241 | 2m 55s | 16m 34s | 0 |
| 85% pre-registered · 4 counters · 8 kiosks | 241 | 5s | 13m 41s | 0 |
Waiting averages cover arrived jobs, including unfinished waits; cycle averages cover completed jobs only. These are synthetic calculations, not measured site performance, revenue or a safety assessment.
Engine, status and output notes
process-des-2.7.0. Status: 4 staffed counters · 4 kiosks: completed; 6 staffed counters · 4 kiosks: completed; 4 staffed counters · 8 kiosks: completed; 85% pre-registered · 4 counters · 8 kiosks: completed. “Completed” is the engine run status, not success for every job. Check blocked jobs and warnings.
- No engine warnings.
Engine inputs and saved comparisons stay with the saved project. Any limited trace affects playback details, not aggregate metrics.
Plan in 2D. Inspect in 3D. Keep the whole project.
- Open and adjust. Switch between 2D and 3D; edit a part, a floor or an input. Both views describe the same model.
- Connect your agent for free. Sign in, choose Connect AI and connect ChatGPT, Claude, Codex or Claude Code. Ask it to inspect the example, edit the layout and check a route.
- Save a checkpoint. Project → Project file, or ask the agent to export the complete project. Import it later to restore floors, scenarios, saved comparisons and the selected view.
- Compare options. Run new operational comparisons under the same demand. Check Account for execution access, built-in AI and manual cloud-saving limits.