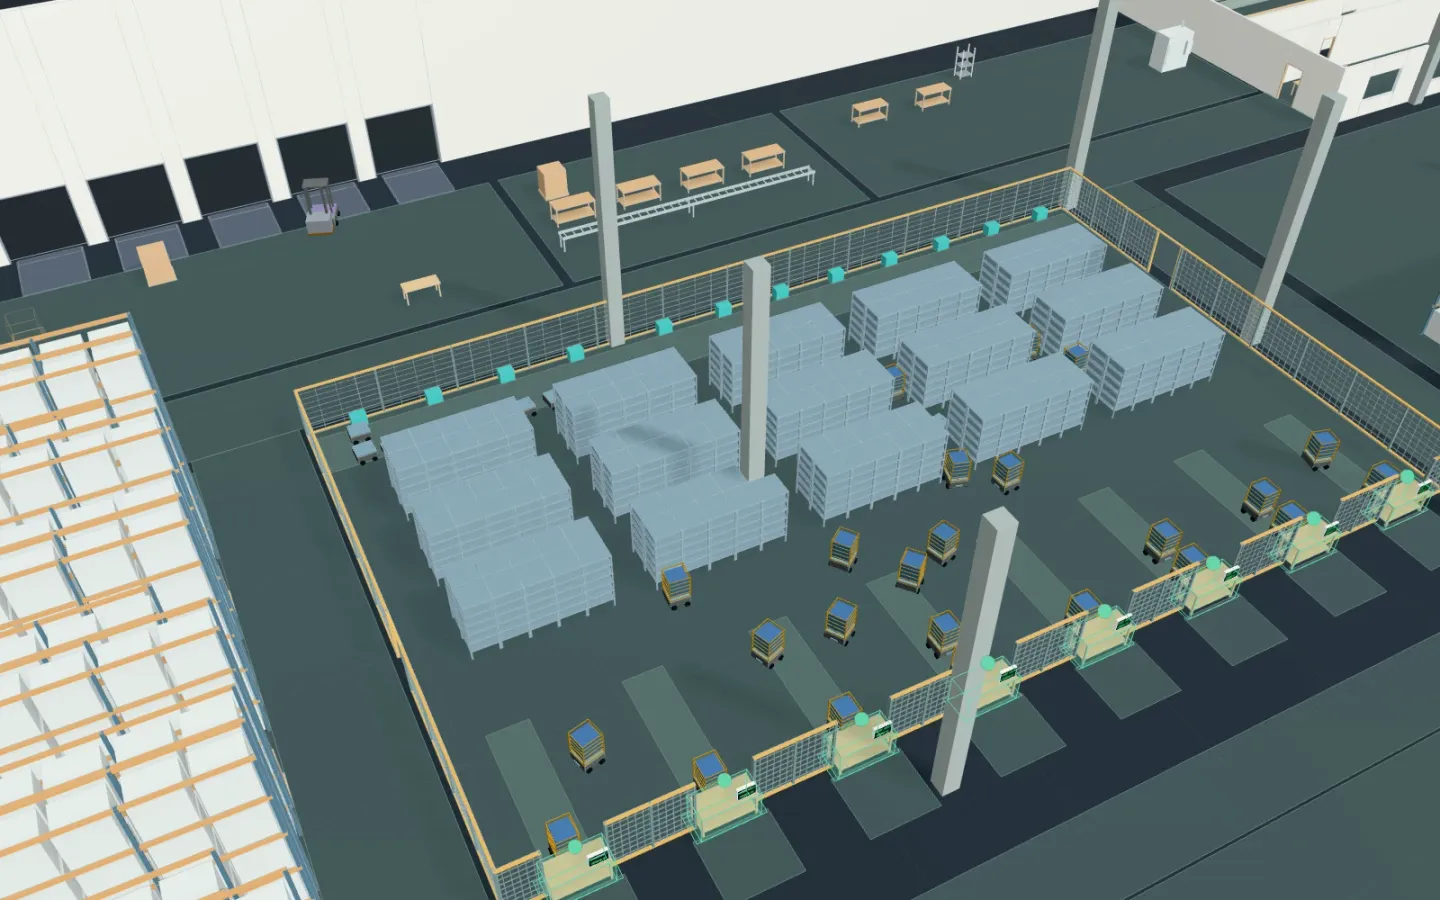
Open the robot picking warehouse (no account needed to open it; running simulations takes Pro). Will more robots ship orders faster, or are the pick stations already the limit? With the same orders, your AI changes the robots in service and the pick time and compares them in a simulation. This article runs on a synthetic warehouse with the same tools your AI calls over MCP. Every number below comes from that run.
1. The warehouse and the robots
In the synthetic warehouse, order lines arrive at random for 30 minutes at 1,000 an hour (Poisson arrivals, 506.4 in the half hour on average).
- One of the drive units in service (32 today, of a fleet of 40) lifts one of 24 pods and takes it to a free one of eight goods-to-person stations (robots on their way count; else the lane with the fewest ahead).
- The station’s picker works 24 s plus 2 to 12 s, and the pod goes back to its place. Items ride the conveyor to twelve pack benches; two forklifts and six mezzanine pickers work too.
- Not counted: robot traffic and collisions, charging, pod slotting, order batching, conveyor accumulation, trailer loading.
2. Robots in service
Your AI ran the saved scenario’s parameter, the robots in service, at each value with sweep_process_parameters, twenty runs each on the same random numbers.
| Robots in service | Lines done (of 506.4) | Time per line | Wait for a robot | Wait in the station lane | Stations busy |
|---|---|---|---|---|---|
| 16 | 460.2 | 479.3 s | 287.4 s | 2.4 s | 80 % |
| 20 | 505.7 | 337.4 s | 112.1 s | 6.8 s | 83 % |
| 24 | 506.4 | 320.8 s | 82.6 s | 19.0 s | 83 % |
| 28 | 506.4 | 320.1 s | 69.4 s | 31.7 s | 83 % |
| 32 (today) | 506.4 | 320.1 s | 58.4 s | 42.7 s | 83 % |
- Beyond 24 robots the time per line does not change (0.7 s against 32, 95 % interval −0.1 to 1.4 s: no difference shown). The wait for a robot falls, but the wait in the station lanes grows by as much: the eight stations are busy 83 % of the time, and they are the limit.
- With 16 robots, 46.2 lines were not done in the half hour, and a line took 479.3 s.
3. A faster pick
Your AI cut the pick from 24 s to 16 s, with 24 and with 32 robots. Time per line:
| Robots in service | 24 s pick | 16 s pick |
|---|---|---|
| 24 | 320.8 s | 219.4 s |
| 32 | 320.1 s | 219.7 s |
- A 16 s pick cuts the time per line by about 100 s (100.7 s against 32 robots and 24 s, 95 % interval 80.4 to 121.0 s): more than more robots do.
- The stations are then busy 62 % of the time, and the wait for a robot almost disappears (1.9 s with 24).
4. A quieter day
At 800 lines an hour, can fewer robots do? Time per line:
| Robots in service | 1,000 lines an hour | 800 lines an hour |
|---|---|---|
| 16 | 479.3 s (460.2 lines done) | 291.5 s (all 402.5) |
| 24 | 320.8 s | 229.9 s |
- On an 800-line day, 16 robots finish every line.
5. How to use these numbers
- Give your AI the order lines by hour, the pick time per pod visit and the pack times, the robot speed and the robots in service, and the stations and benches.
- Before adding robots, check whether the stations are already the limit. Weigh any gain in lines an hour against robot, station and labour cost; this is not a forecast of order volume or sales.
- Check robot traffic, charging, pod slotting and conveyor capacity with the vendor’s simulator or site data before sizing a fleet.