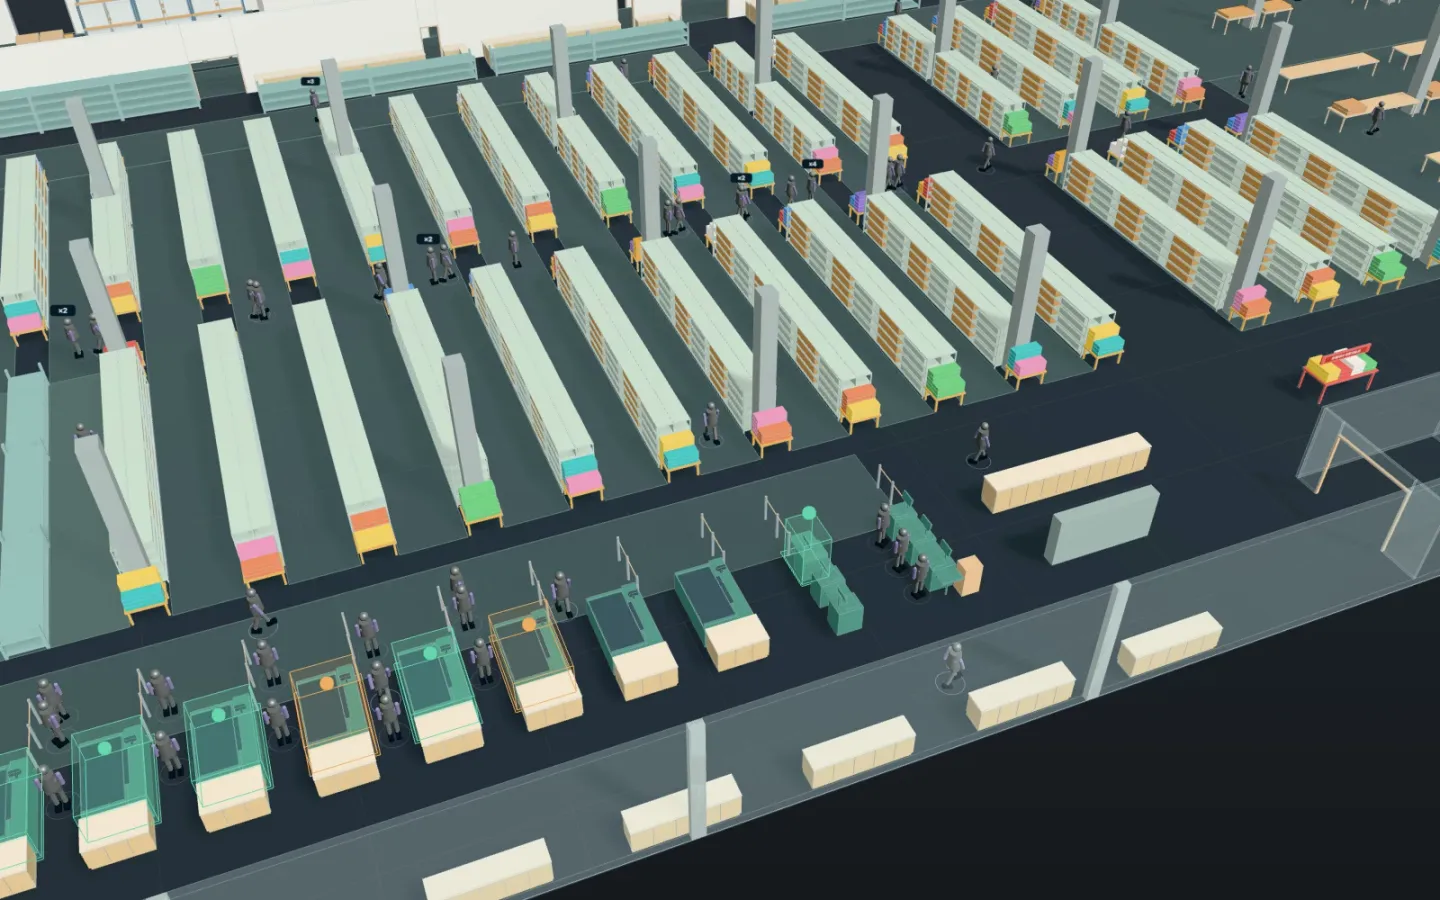
Open the supermarket (no account needed to open it; running simulations takes Pro). How long will shoppers wait with so many checkouts open? Say how many come in an hour and how long each takes, and your AI simulates the wait for each number of lanes. This article runs on a synthetic supermarket with the same tools your AI calls over MCP. Every number and picture below comes from that run.
1. The shop and its checkouts
The synthetic supermarket is an out-of-town shop with a sales floor and a car park. Along the front aisle stand ten staffed checkouts, 2.8 m apart; east of them, six self-checkouts with one line; and beyond them the way out. The times per shopper are those already in the model.
- Staffed lanes: scanning takes 90 s on average (longer for bigger baskets: an exponential distribution) and paying 20–40 s. With the 2 s step up to the belt, a shopper holds a lane for about 2 minutes on average (122 s). Bagging (20–45 s) happens past the till, which is free for the next shopper meanwhile.
- Self-checkouts: scanning and paying take 60–300 s (110 s most often), and bagging 15–30 s.
2. The scenario your AI wrote
Your AI took the lane steps from the saved Saturday checkout scenario as they are, and wrote “the hour at the checkouts” without the shopping trip (put_process_scenario).
- Shoppers who have finished shopping come to the front aisle at random (Poisson arrivals), so many an hour.
- Each takes a free lane, or else the one with the fewest waiting, and never changes lines.
- The lanes nearest the middle of the aisle open first (5, 6, 4, 7, 3, 8, 2, 9, 1, 10).
- The first 10 minutes are not counted; the hour after them is. Twenty runs, on different random numbers.
The footfall, the lanes open, whether there is one line, and the share sent to self-checkout are the scenario’s parameters. With sweep_process_parameters, your AI runs the same twenty runs at each combination of them.
3. Lanes open by footfall
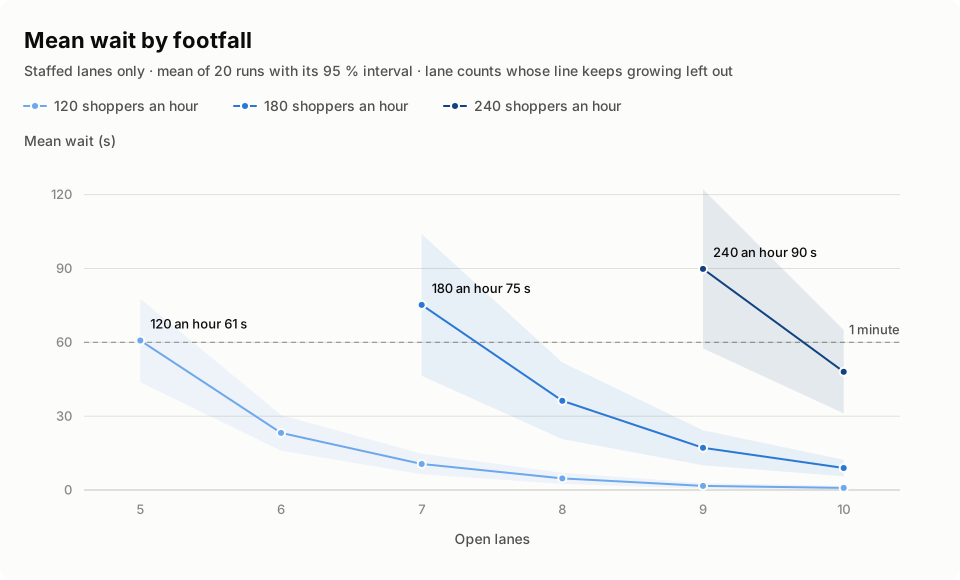
| Shoppers an hour | 4 lanes | 5 | 6 | 7 | 8 | 9 | 10 |
|---|---|---|---|---|---|---|---|
| 120 | × | 61 s | 23 s | 11 s | 5 s | 2 s | 1 s |
| 180 | × | × | × | 75 s | 36 s | 17 s | 9 s |
| 240 | × | × | × | × | × | 90 s | 48 s |
× marks the lanes open with which the line kept growing: fewer shoppers paid in the hour than came (113 of 120 with 4 lanes, 170 of 180 with 6, 227 of 240 with 8).
- With 120 shoppers an hour, the checkouts have 120 × 122 s = 4.07 lanes’ work. Four lanes are not enough: the line grows all the hour. Five, the work rounded up, stop it growing, but the mean wait is 61 s. To keep the mean under a minute took one lane more: 23 s with 6.
- It is the same with 180 (6.1 lanes’ work) and 240 (8.1): under a minute took 8 and 10 lanes.
- A short mean still leaves some waiting long. With 180 an hour and 8 lanes (36 s on average), each run’s longest wait, averaged over the 20 runs, came to 266 s at the lane where it was longest (about four and a half minutes). A big basket ahead holds up that line alone.
4. One line for all the lanes
One line in front of all the open lanes, its head going to whichever lane frees first. Your AI switched the scenario’s one-line parameter and compared, again with 180 shoppers an hour. The longest wait and line are each run’s longest, averaged over the 20 runs (with a line at each lane, at the lane where it is longest).
| 180 an hour | A line at each lane | One line |
|---|---|---|
| 7 lanes: mean wait | 75.2 s | 73.5 s |
| 7 lanes: longest wait | 373 s | 246 s |
| 7 lanes: longest line | 2.3 (one lane’s) | 13.8 (the one line) |
| 6 lanes: mean wait | 181.4 s | 204.6 s |
- With 7 lanes the mean wait does not change: the difference is −1.7 s, with a 95 % interval from −7.9 to 4.5 s, so no difference is shown. The longest wait drops from 373 s to 246 s: luck no longer turns on the basket ahead, and shoppers go in the order they came.
- But the one line grows to about 14 at its longest (13.8 on average over the 20 runs). It needs room, and a sign showing which lane is free.
- With 6 lanes, only just enough, the one line made the mean wait 23.1 s longer (95 % interval 13.7 to 32.5 s): while the shopper at its head walks a few seconds to the lane that freed, that lane stands empty.
5. Sending shoppers to self-checkout
Of the same 180 shoppers an hour, a share goes to the self-checkouts (six, with one line). The mean wait is that of every shopper, at the staffed lanes and the self-checkouts together.
| To self-checkout | 4 staffed | 5 | 6 | 7 | Self-checkout mean wait | Self-checkout line (longest) |
|---|---|---|---|---|---|---|
| 0 % | × | × | × | 75 s | – | – |
| 30 % | × | 55 s | 21 s | 9 s | 2.6 s | 1.5 |
| 50 % | 47 s | 30 s | 25 s | 24 s | 44.7 s | 6.6 |
- With 30 % at the self-checkouts, 5 staffed lanes instead of 7 still give a mean of 55 s, and there is next to no wait at the self-checkouts.
- With 50 %, even 4 staffed lanes give a mean of 47 s, but the wait moves to the self-checkouts: 44.7 s on average, the line up to 6.6, and the six in use 79 % of the time. With 7 staffed lanes that wait remains, and the mean of everyone is 24 s.
6. How to use these numbers
- The footfall is in your receipts by hour (the POS customer count). Give your AI the times you measured in your own shop: the wait at each number of lanes turns on them.
- Not counted: changing lines, shoppers who give up at a long line, cashiers working at different speeds, breaks and changeovers, and sales.
- A shop with two checkouts can compare one open against two with
run_standard_scenario. - The saved Saturday checkout scenario takes shoppers from the car park round the sales floor to the checkouts. Try other shares at self-checkout, scanning times, or when a cashier takes a break.