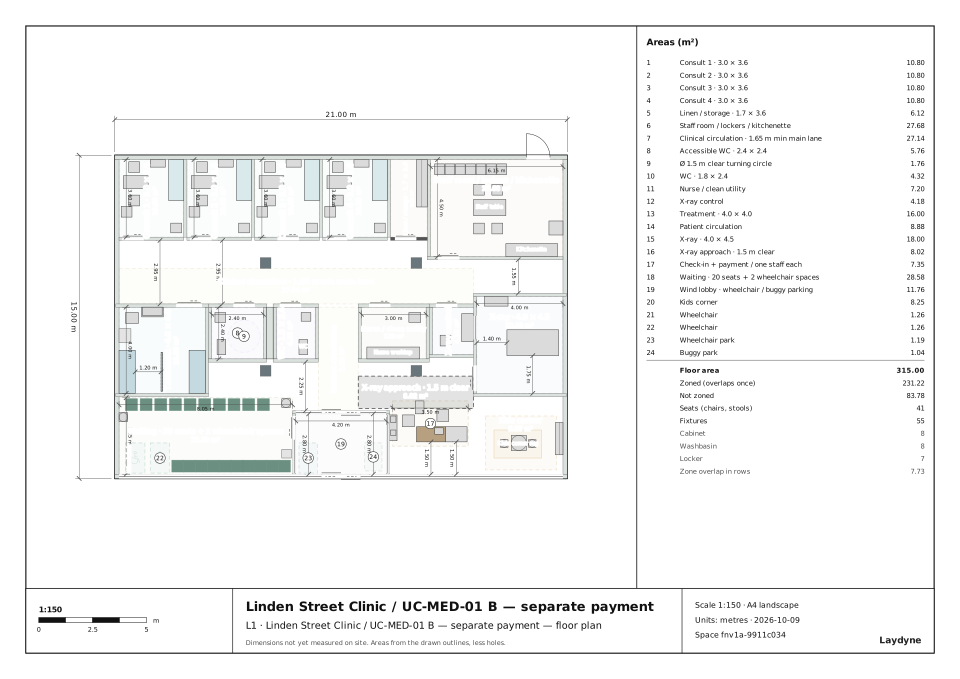
Linden Street Clinic is a fictional planning model. B shortens walking by 17.42 m per arrived patient but increases average patient waiting by 20.37 seconds. The 20 paired seeds do not establish a difference in total visit time or peak seat shortfall. B is a trade-off to investigate, not an established improvement.
This new comparison copies the earlier clinic proposal without changing it. Both current A and B use the same four consultation rooms and current medical parts. The earlier article's 29.5 minutes and 92% doctor utilisation are historical results with different inputs and denominators; they are not the results below. Full-precision facts, the frozen comparison and seed-level values accompany the files.
Change the windows and allocation, keep demand and staff fixed
A shares two reception staff between check-in and payment. B assigns one to each function and separates the payment window. These staffing and window-location changes occur together, so their combined effect cannot be attributed to walking distance alone.
| Common input | Both options |
|---|---|
| Building | 21 × 15 m; 315 m²; four 3.0 × 3.6 m consultation rooms |
| Staff | Seven: two doctors, two nurses, one radiographer and two reception/payment staff |
| Waiting area | 20 drawn chairs and two assumed wheelchair bays |
| Arrivals | Poisson: 24/hour for one hour, 16/hour for one hour, 10/hour for 30 minutes, then none |
| Service durations | Check-in uniform 60–180 s; consultation triangular 240/420/720 s; treatment uniform 300–900 s; imaging uniform 300–600 s; review uniform 120–240 s; payment uniform 60–120 s |
| After consultation | Mutually exclusive branches: 70% no further clinical step, 20% treatment, 10% imaging |
| Runs | 20 paired seeds, 20261009–20261028; each 21,600 s; warmup 0; engine process-des-2.7.0 |
| Patient model | Circular radius 0.30 m, height 1.70 m, speed 1 m/s |
The arrival ID and ordering, branch order, service draws and four-room selection order are common. Comparing only the same seed number without preserving those inputs would be insufficient. Room choice can still differ as the two systems become busy.
All 20 runs in each option reached the full six-hour window without warnings, event/job-limit stops or excluded seeds. Each option had 867 arrivals and 867 completions across its 20 runs; no unfinished, blocked or remaining work was recorded.
Read the waiting and walking effects separately
Values below are means across 20 seeds. Differences are paired B−A with 95% Student t intervals.
| Metric | A | B | B−A, 95% interval |
|---|---|---|---|
| Mean patient waiting | 1,902.16 s | 1,922.54 s | +20.37 s [9.97, 30.77] |
| Mean completed visit time | 2,854.29 s | 2,857.25 s | +2.95 s [−7.45, 13.36] |
| Total patient distance per run | 4,101.45 m | 3,345.46 m | −755.99 m [−822.68, −689.30] |
| Distance per arrived patient | 94.76 m | 77.34 m | −17.42 m [−17.55, −17.29] |
| Check-in step waiting | 18.71 s | 122.93 s | +104.23 s [71.32, 137.14] |
| First doctor step waiting | 1,698.37 s | 1,619.50 s | −78.87 s [−109.94, −47.80] |
| Payment step waiting | 9.48 s | 11.31 s | +1.83 s [−0.71, 4.37] |
Patient waiting sums all waiting for every arrived patient, including waiting accumulated by unfinished patients at the horizon. Completed visit time uses completed patients only. All patients finished here, but those definitions still differ. Resource waiting uses resource requests as its denominator, not unique patients.
For distance per patient, divide each seed's distance by its arrivals before averaging the 20 values. Staff travel is not included. For post-imaging doctor waiting, the means are 1,757.55 s for A and 1,682.57 s for B from 19/20 valid seeds each. Seed 20261027 had no imaging patient; the saved comparison leaves its paired difference unavailable rather than treating the missing value as zero.
The total visit-time interval includes zero. Shorter walking therefore does not establish a faster overall visit in this experiment.
Observe demand for 20 seats without hiding overflow
Patients explicitly move into the waiting polygon before waiting for the doctor, nurse or radiographer. The observation zone uses occupy mode and a high capacity of 1,000. Capping that zone at 20 could keep people outside it and conceal the very excess demand being checked.
| Waiting-demand observation | A | B |
|---|---|---|
| Mean peak occupancy | 14.30 | 13.75 |
| Largest peak across 20 seeds | 32 | 29 |
| Mean shortfall at each seed's peak | 0.75 seats | 0.55 seats |
| Largest shortfall | 12 seats | 9 seats |
| Seeds exceeding 20 | 3/20 | 3/20 |
Shortfall is derived separately for every seed as max(0, peak − 20), then summarised. Its paired mean difference is −0.20 seats, 95% interval [−0.53, 0.13], which includes zero. The same three seeds exceed 20 in both options: 20261010, 20261013 and 20261015.
This is a waiting-area demand approximation, not an assignment to actual chairs or a measured standing queue. A sampled occupancy series exists only for the first seed, at 180 s intervals: neither option has samples above 20 there. It does not establish zero shortage time across all 20 seeds or exact seconds without a seat.
Keep the utilisation denominator visible
| Resource | A | B |
|---|---|---|
| Two doctors | 50.565% | 50.567% |
| Consultation room 1 | 26.50% | 26.54% |
| Consultation room 2 | 25.65% | 25.82% |
| Consultation room 3 | 24.46% | 24.46% |
| Consultation room 4 | 24.52% | 24.32% |
Utilisation is held unit-seconds divided by supplied capacity × 21,600 seconds. Holding a resource while travelling or waiting for another resource counts; this is not a measurement of active clinical work. These doctor and room differences all have intervals including zero. No fifth-room option was calculated.
The shared two-person reception resource and the two separate one-person resources do not have a combined paired resource comparison. Their mean waits are not added together. Patient-level and step-level results above support the stated comparison.
Check named operating sides, with explicit geometric assumptions
The saved checks have zero findings in both options, with four excluded gaps retained separately. A 0.90 m overall clearance check and 1.50 m checks in three tagged passage regions are separate conditions. Consultation door openings are assumed 1.00 m, treatment/imaging openings 1.20 m; they are not presented as 1.50 m passages.
The four consultation couches use a west-side operating point with assumed 0.95 m side clearance. The left treatment couch uses its east side, 1.20 m; the right uses its west side, 1.24 m. The X-ray unit uses its south side, 1.75 m. Patients of circular radius 0.30/0.45 m and staff of radius 0.30 m reached 100 named targets in total: 49 in A and 51 in B, including those equipment sides. Scenario destinations were checked after registration too.
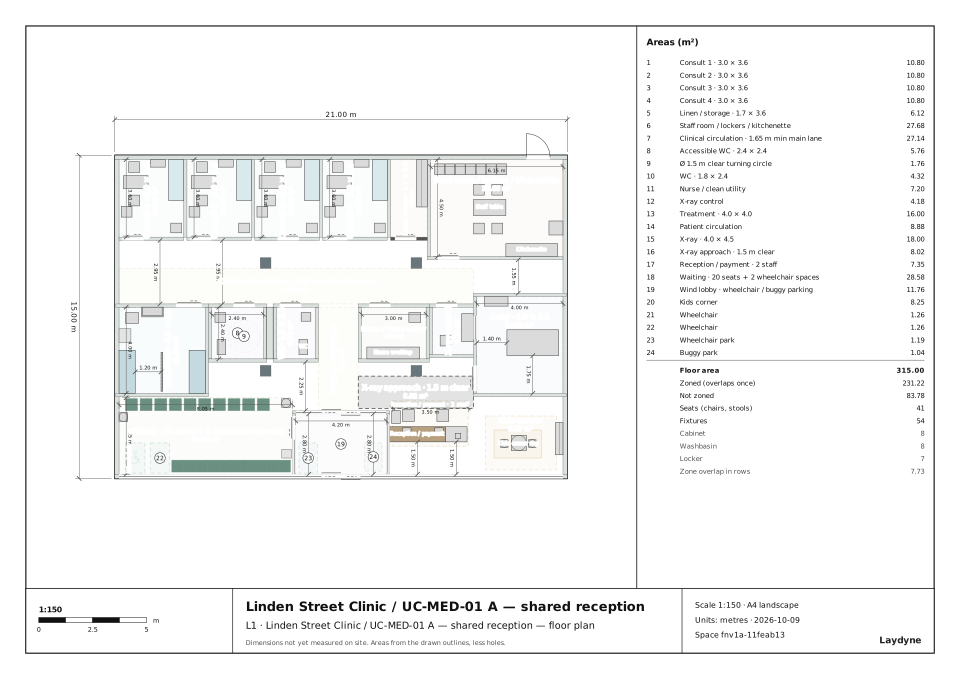
These are assumed points and circular reach checks. They do not establish supplier clearances, real wheelchair length or turning, bed transport, collision avoidance, clinical safety, infection control, radiation shielding, legal compliance or prediction accuracy at a real clinic. The treatment process uses one representative service point; it does not assign patients to the two drawn beds or simulate staff movement.
Open the saved projects, desktop views and checked PDFs
Creation, scenario registration, comparison and reporting used actual MCP through the normal local Pro development login. No built-in AI provider call was made. A and B were named browser saves at revision 3 and reopened through separate MCP sessions. Geometry, scenarios, options, frozen comparison, packed results and reports matched; all four HTML re-exports had identical hashes. Reopening did not rerun the simulation.
Both options were also checked in the current local Studio in desktop Chrome. Actual 3D and 2D views, new named browser saves and reopening from the project list passed. The saved project content and view matched after reopening; the original projects and four HTML files remained unchanged.
The decision report has one A4 authored page plus three A4 evidence pages per option: four pages in total. The submission report has two A3 authored pages plus six A4 evidence pages: eight pages in total. All four PDFs were exported through the real Studio renderer via MCP, and all 24 pages passed visual inspection and independent review.
- Complete current A project and complete current B project.
- A: decision PDF, 4 pages and submission PDF, 8 pages; decision HTML and submission HTML.
- B: decision PDF, 4 pages and submission PDF, 8 pages; decision HTML and submission HTML.
- Full-precision facts, frozen comparison, and all 20 seed pairs.
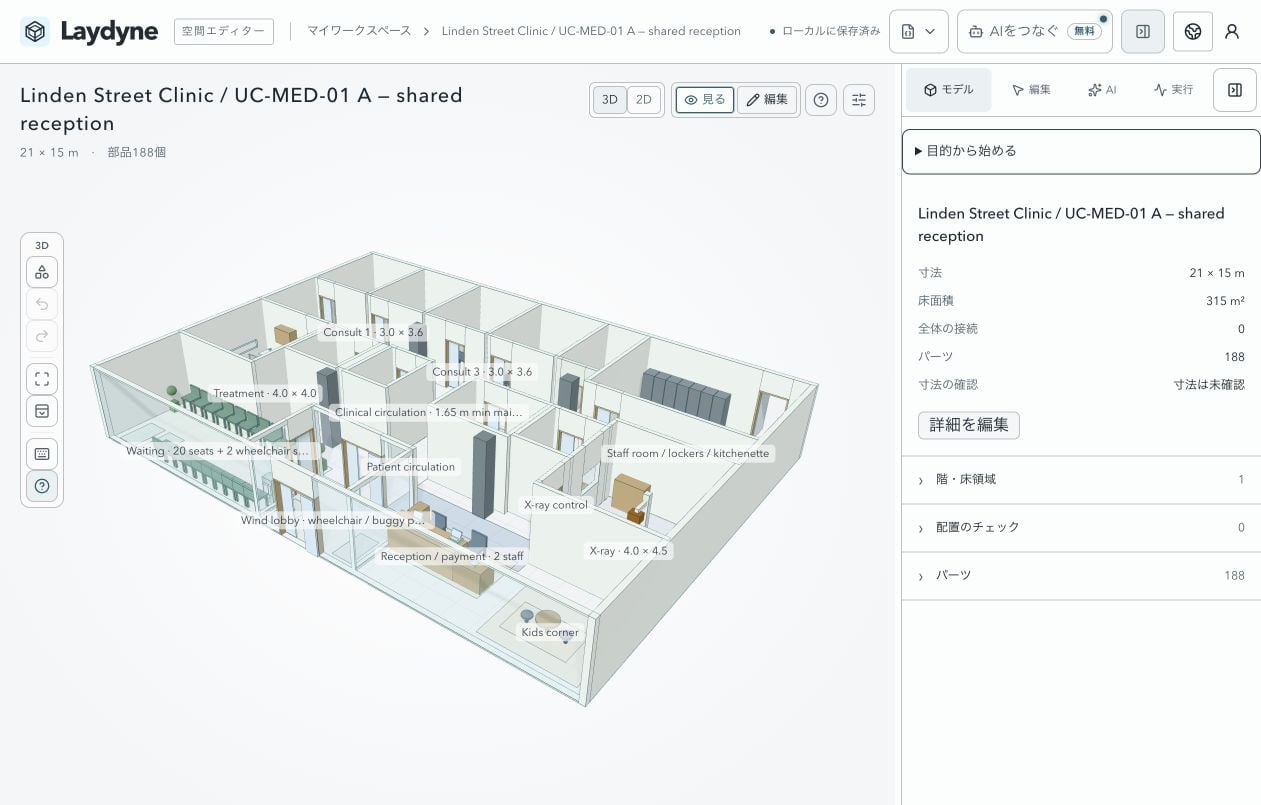
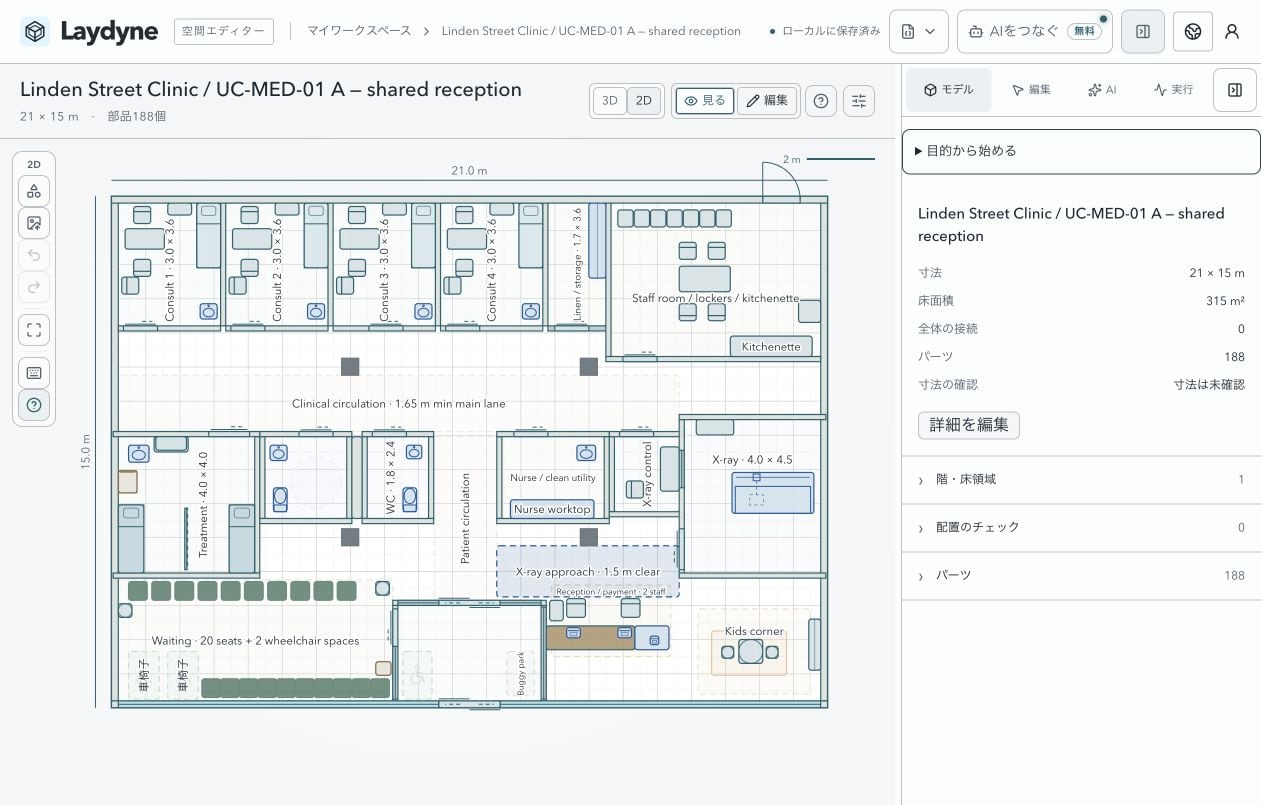
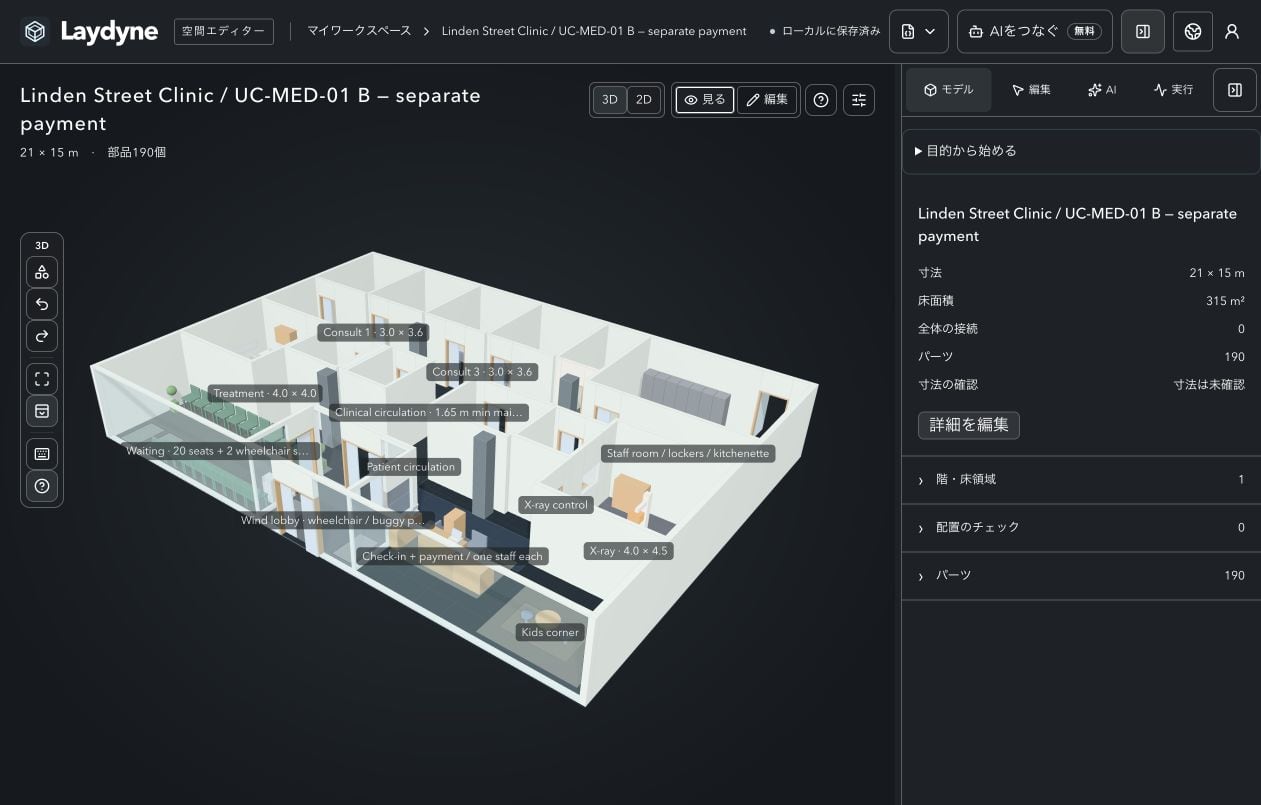
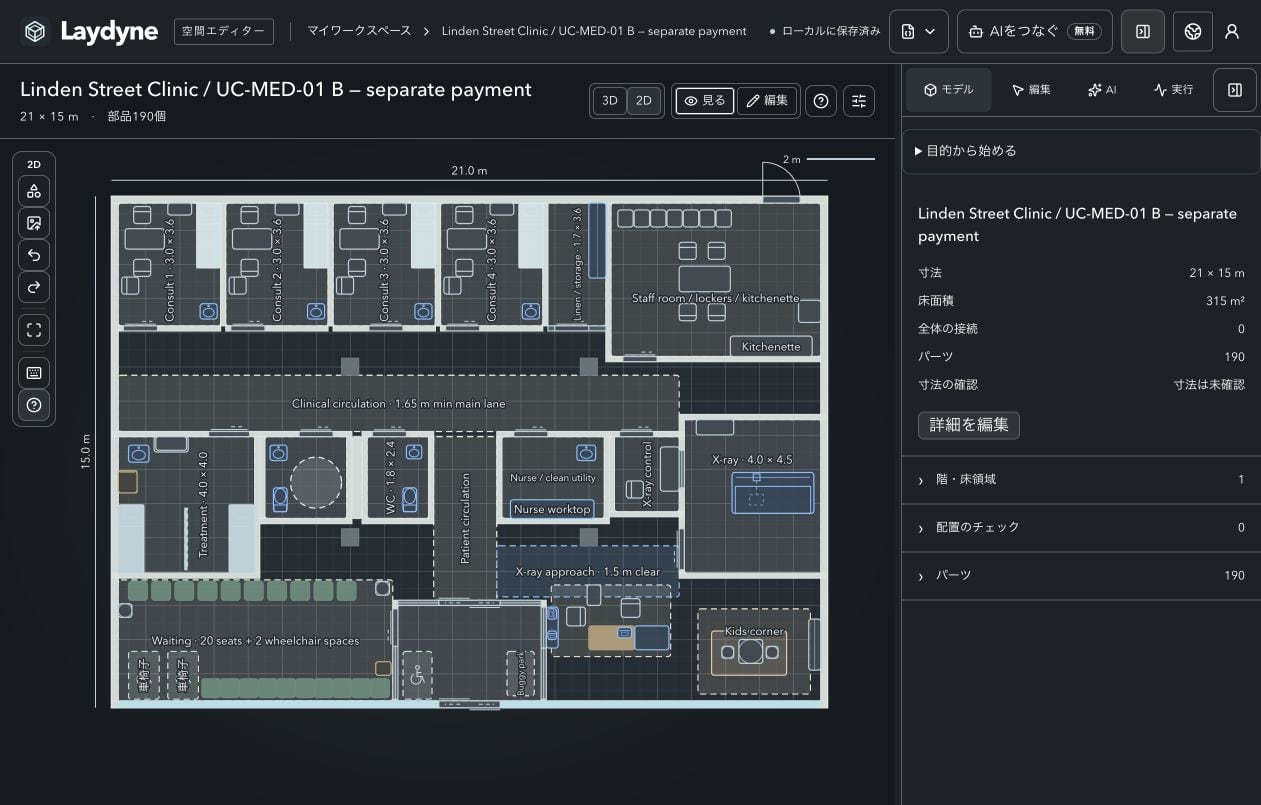
The earlier plan diagrams are static MCP exports; the four images above are actual desktop captures. A 390 px viewport remains unverified. The PDFs are raster output without selectable text; physical printing and production browser acceptance were not checked. The reports' drawings are page insets; use their written dimensions, not a ruler on the inset.
Free can open the models, inspect evidence and replay saved results. Recalculation requires Pro. Use these synthetic assumptions to frame a measured study; the results alone do not decide a real clinic's layout or staffing.