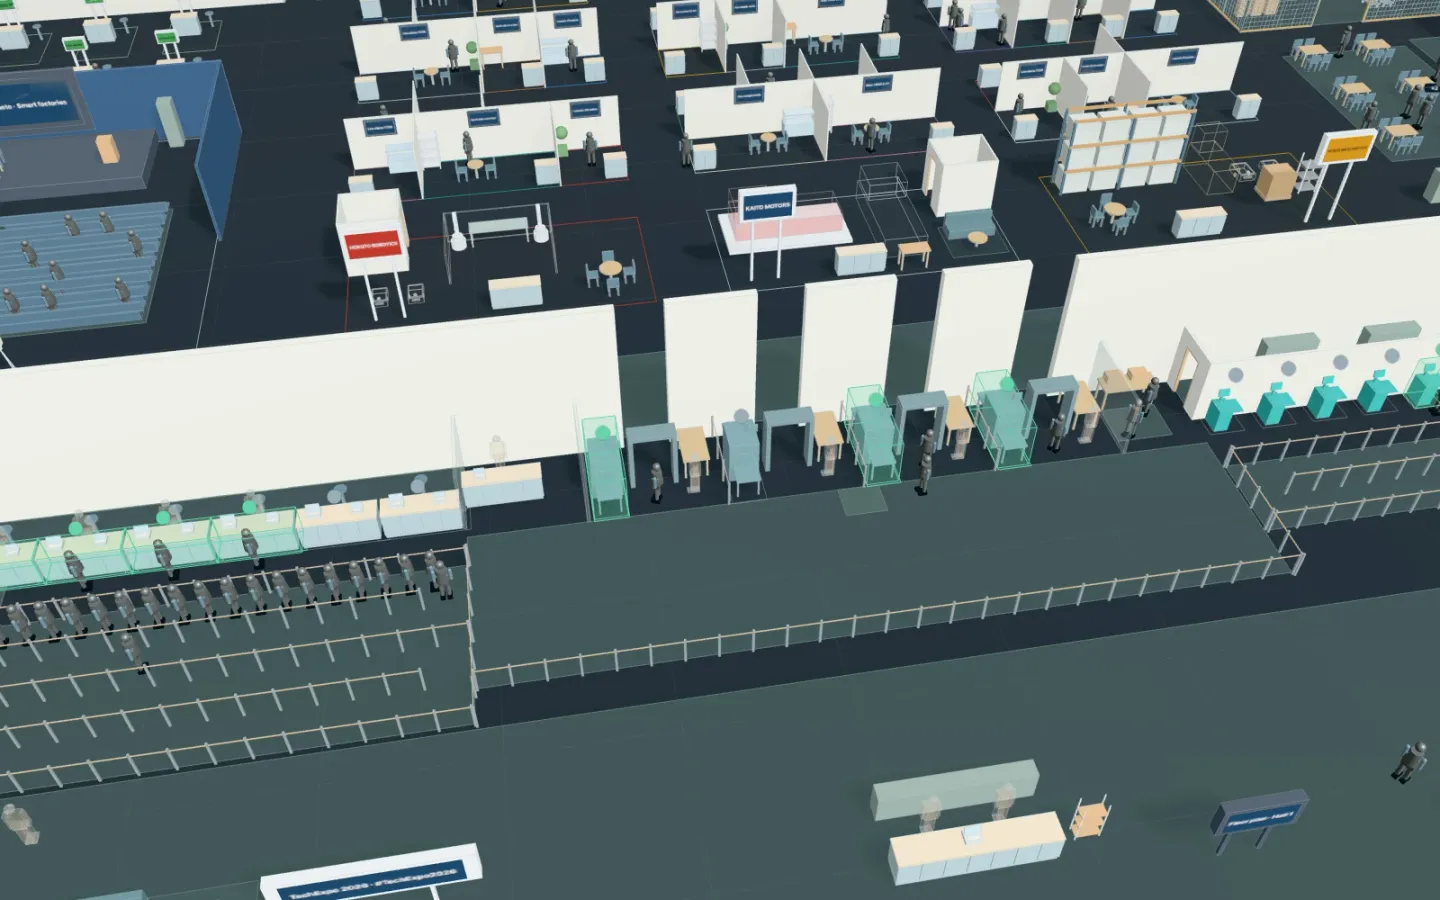
Open the expo opening morning (no account needed to open it; running simulations takes Pro). On the opening morning, how many staffed counters and QR kiosks keep visitors from waiting, and does more pre-registration do the same as more counters? With the same visitors, your AI changes the desks and the pre-registered share and compares them in a simulation. This article runs on a synthetic show with the same tools your AI calls over MCP. Every number below comes from that run.
1. The show and the opening morning
The synthetic trade show opens at 09:00.
- Visitors come at random from the station walkway, the taxi rank, the shuttle bus and the car park, in a morning wave (a base of 200 an hour: that rate for the first 10 minutes, 2.5 times it for the next 15, 1.5 times for the next 15 and 0.6 times for the last 10; 253.9 visitors on average over 10 runs). 12 % leave a coat at the cloakroom.
- 70 % are pre-registered and wait in one line for a free QR kiosk (scanning and printing 25 to 90 seconds, then a lanyard). The rest wait in one winding line for the staffed walk-up counters (form, photo ID and badge 90 to 240 seconds, printing 10 to 20).
- Everyone then waits for the bag check (10 to 30 seconds) and goes into the hall.
- Today 4 staffed counters (of 6), 4 kiosks (of 8) and 4 bag check lanes are open.
- Not counted: crowd physics, visitors who leave or switch lines, forecasts of visitors, leads or sales.
2. Where visitors wait
A run takes long to compute, so your AI ran sweep_process_parameters two points a call (today’s settings and one other), 10 times each with the same random numbers. With today’s settings:
| Line | Visitors | Mean wait | Longest wait | Longest line |
|---|---|---|---|---|
| Staffed counters | 77.3 | 9.0 min | 17.2 min | 24.8 |
| QR kiosks | 176.6 | 2.2 min | 5.3 min | 23.6 |
| Bag check | 253.9 | 0.3 s | 14.3 s | 2.1 |
- The walk-ups, 3 tenths of the visitors, wait 9.0 minutes on average. With the cloakroom and the bag check included, a visitor’s waiting in all comes to 4.4 minutes, on average over everyone.
- The longest wait and the longest line are each run’s longest, averaged over the 10 runs.
3. Changing the desks
| What changed | Staffed counters | QR kiosks | Bag check | A visitor’s waiting in all |
|---|---|---|---|---|
| Today | 9.0 min | 2.2 min | 0.3 s | 4.4 min |
| 5 staffed counters | 4.7 min | 2.2 min | 0.5 s | 3.0 min |
| 6 staffed counters | 2.3 min | 2.2 min | 0.7 s | 2.3 min |
| 8 kiosks | 9.0 min | 0.0 min | 1.5 s | 2.9 min |
| 85 % pre-registered | 0.8 min | 5.3 min | 0.3 s | 4.6 min |
| 85 % pre-registered, 8 kiosks | 0.8 min | 0.1 min | 2.9 s | 0.2 min |
| 2 bag check lanes | 9.0 min | 2.2 min | 126.1 s | 6.5 min |
- With 6 staffed counters, a visitor’s waiting in all is 2.1 minutes shorter (run for run, 95 % interval 1.4 to 2.8).
- With 8 kiosks the staffed counters still wait 9.0 minutes; in all, visitors wait 1.5 minutes less.
- With 85 % pre-registered the staffed counters wait 0.8 minutes, but with 4 kiosks the line moves to the kiosks (5.3 minutes, a longest line of 45.0) and the waiting in all does not change (the difference takes in 0). With 8 kiosks as well it is 0.2 minutes, 4.2 shorter (95 % interval 3.1 to 5.2).
- With the bag check cut to 2 lanes, visitors wait there 2.1 minutes on average (5.0 at most), and 2.1 minutes longer in all.
4. How to use these numbers
- Give your AI when visitors arrive (from the last show’s entry gates), the pre-registered share, a visitor’s time at a counter and at a kiosk, and the bag check time, measured at your own event; and what a staff member and a kiosk cost.
- When you push pre-registration, check the kiosks with it.
- Not counted: crowd physics, visitors who leave or switch lines, forecasts of visitors, leads or sales.