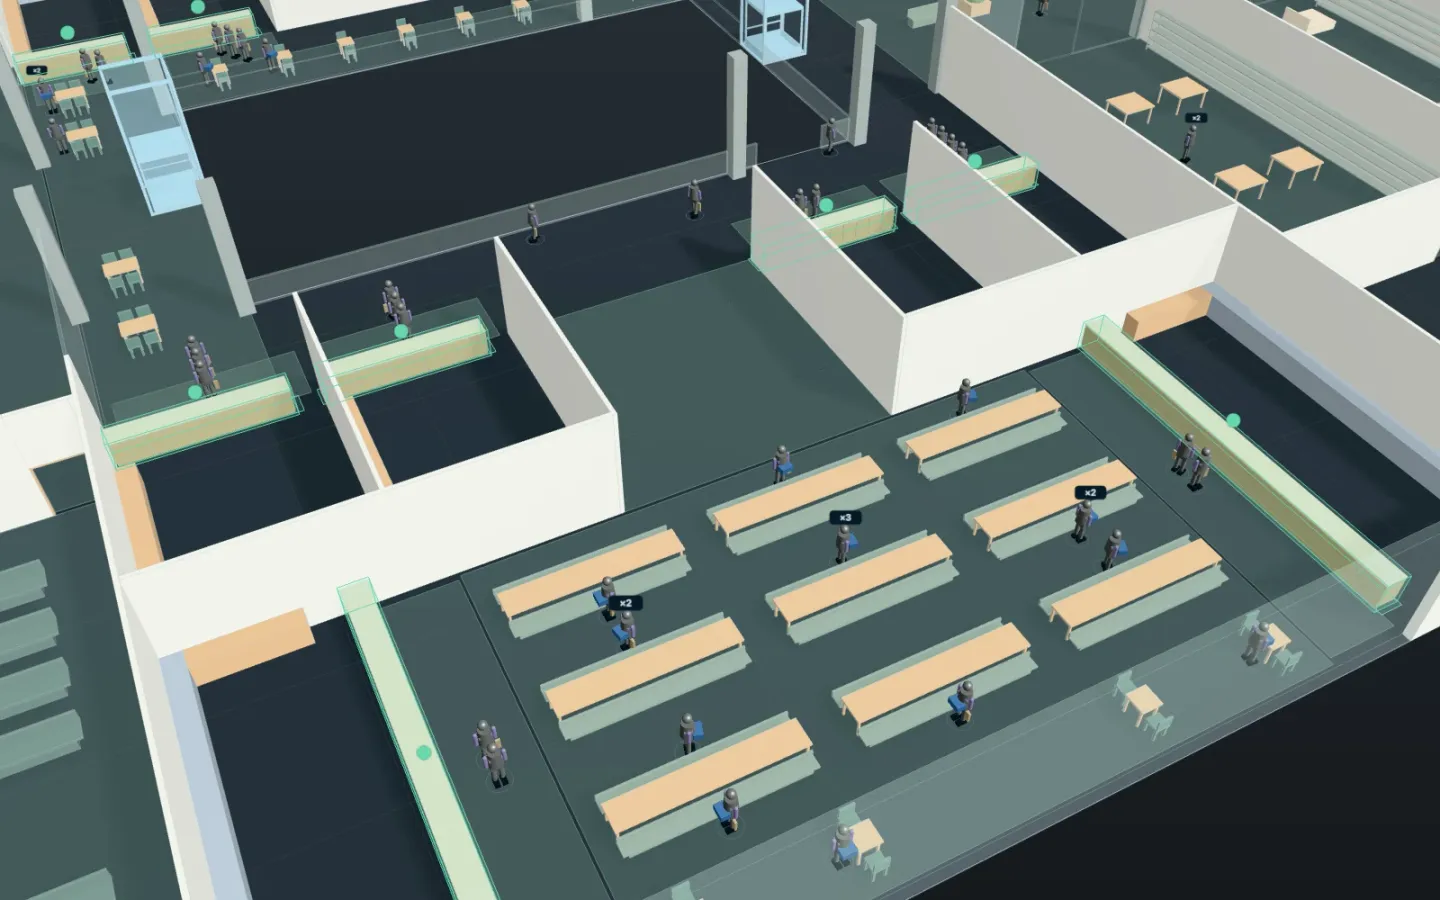
Open the shopping centre Saturday (no account needed to open it; running simulations takes Pro). At a Saturday peak, which food-court stalls queue, and does faster cooking clear the lines? With the same visitors, your AI changes the cooking time and the share going to eat and compares them in a simulation. This article runs on a synthetic centre with the same tools your AI calls over MCP. Every number below comes from that run.
1. The centre and the Saturday peak
The synthetic centre has three levels, with a food court of 10 stalls on the third.
- Visitors arrive in the first 15 minutes: by car (at random, at 360 an hour), on three shuttle buses (8 each) and step-free by lift (at 40 an hour). After shopping on 1 to 3 levels, 45 % go to the food court, 10 % to the cinema, and the rest home. At 10 minutes an earlier film lets out, and half of its 40 viewers come to the food court.
- In the food court a diner chooses noodles (40 %: ramen, udon, curry, okonomiyaki), fast food (35 %: burgers, Korean, pizza) or sweets (25 %: crêpes, bubble tea, desserts), and queues at a free stall of that kind (or, when all are taken, the one with the fewest ahead).
- A stall takes and cooks one order at a time (ordering 20 to 45 s, cooking 120 s on average and varying, 3 s to take the tray). The wait is the time from joining the line to ordering.
- 73.1 diners come to the food court in the hour, on average over the 20 runs.
- Not counted: crowd physics, diners who leave or switch lines, groups, sales.
2. Which stalls queue
Your AI ran the saved scenario unchanged 20 times with the same random numbers using sweep_process_parameters, and read every stall’s wait, line and busy share (today’s settings). The line is each run’s longest, averaged over the 20 runs.
| Stall | Kind | Diners | Wait | Longest line | Busy |
|---|---|---|---|---|---|
| Ramen | Noodles | 8.3 | 2.0 min | 2.0 | 33 % |
| Udon | Noodles | 7.3 | 2.7 min | 2.2 | 35 % |
| Curry | Noodles | 7.8 | 2.4 min | 2.2 | 33 % |
| Okonomiyaki | Noodles | 7.8 | 2.3 min | 2.3 | 31 % |
| Burgers | Fast food | 7.8 | 3.4 min | 2.8 | 34 % |
| Korean | Fast food | 8.2 | 3.0 min | 2.6 | 33 % |
| Pizza | Fast food | 8.2 | 2.8 min | 2.5 | 33 % |
| Crêpes | Sweets | 6.0 | 1.6 min | 1.4 | 30 % |
| Bubble tea | Sweets | 6.3 | 1.1 min | 1.3 | 27 % |
| Desserts | Sweets | 5.6 | 1.4 min | 1.3 | 26 % |
- On average the longest wait is at the burger stall (3.4 minutes), and all three fast-food stalls wait 2.8 minutes or more. Sweets wait 1.1 to 1.6 minutes.
- Every stall works only 26 to 35 % of the hour. Because visitors come in the first 15 minutes and when the film lets out, lines form at the peak however long the stalls stand idle. An hour’s average busy share does not tell you whether a line forms.
3. With faster cooking
Your AI made the mean cooking time 90 and 60 seconds instead of 120. The waits at each kind’s stalls (the shortest to the longest):
| Mean cooking | Noodles (4 stalls) | Fast food (3) | Sweets (3) | Time in the centre for car visitors |
|---|---|---|---|---|
| 120 s (today) | 2.0 to 2.7 min | 2.8 to 3.4 min | 1.1 to 1.6 min | 21.4 min |
| 90 s | 1.0 to 1.4 min | 1.7 to 1.8 min | 0.5 to 0.8 min | 20.7 min |
| 60 s | 0.5 to 0.6 min | 0.8 min | 0.3 to 0.4 min | 20.2 min |
- At 90 seconds the burger wait goes from 3.4 to 1.8 minutes (1.6 minutes less, run for run, 95 % interval 1.0 to 2.1). Every stall’s wait falls to 4 to 6 tenths of today’s.
- At 60 seconds, every stall waits under a minute.
4. If more visitors go to eat
Your AI changed the share who go to the food court after shopping (cooking 120 s).
| Going to the food court | Diners | Noodles | Fast food | Sweets |
|---|---|---|---|---|
| 30 % | 56.1 | 1.3 to 1.8 min | 1.9 to 2.3 min | 0.5 to 1.3 min |
| 45 % (today) | 73.1 | 2.0 to 2.7 min | 2.8 to 3.4 min | 1.1 to 1.6 min |
| 60 % | 92.6 | 3.7 to 4.3 min | 4.5 to 4.8 min | 2.1 to 2.2 min |
- At 60 %, fast food waits 4.5 to 4.8 minutes, and noodles 3.7 to 4.3.
5. Faster cooking on a busier day
Your AI made the visitors by car 480 an hour. Fast food then waits 3.9 to 4.3 minutes. With 90-second cooking it waits 2.2 to 2.3, below today’s 120 seconds (2.8 to 3.4). Run for run, the burger wait is 1.1 minutes shorter (95 % interval 0.5 to 1.7) and Korean 0.7 shorter (0.1 to 1.3); the pizza difference takes in 0.
6. How to use these numbers
- Give your AI the visitors by hour (car park and door counters), the share who go to eat, how each kind of food is chosen, and each stall’s cooking times, measured in your own centre; and when films and events end.
- Shorter waits alone do not show extra sales. Weigh faster cooking against what it costs (staff, equipment, the menu).
- Not counted: crowd physics, diners who leave or switch lines, groups, sales.