Start from the office floor model (free sign-up; running a simulation is Pro). In the 2025 telework population survey by Japan’s Ministry of Land, Infrastructure, Transport and Tourism (published 24 March 2026), 25.2 % of employed workers have teleworked. With fewer people in, an office can have fewer desks than staff and let anyone take any desk. In this article, in a mock office floor, your AI makes the 64 desks hot desks and simulates 50 working days. It ran the same tools an AI calls over MCP. Every figure and number below comes from that run.
1. The 64 desks as hot desks
In one change (edit_space) your AI tags the 64 chairs of the eight desk islands as desks anyone may take. Then it writes the day as a scenario (put_process_scenario).
- Each of the staff comes in with a chance (the share coming in) each day.
- Those who come in arrive 8:00 to 10:00 (most often 9:00) and stay 7.5 to 10 hours (most often 9).
- From the lift lobby they walk into the office and take the nearest free desk. With none free, they work in the pantry that day.
- Every time is an assumption, to swap for your own.
Your AI runs 50 days for each case (run_process_scenario) and reads, day by day, who came in and who found no desk.
2. At 60 % coming in, how many staff?
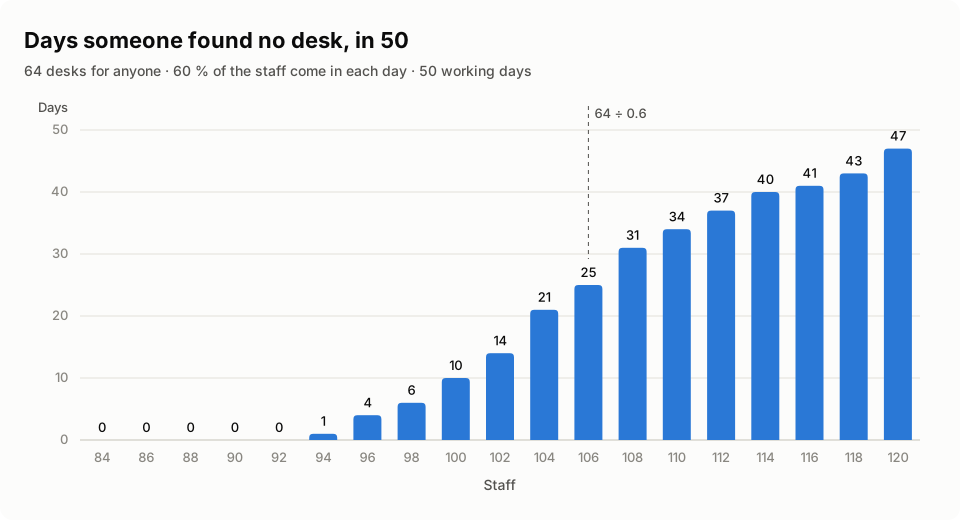
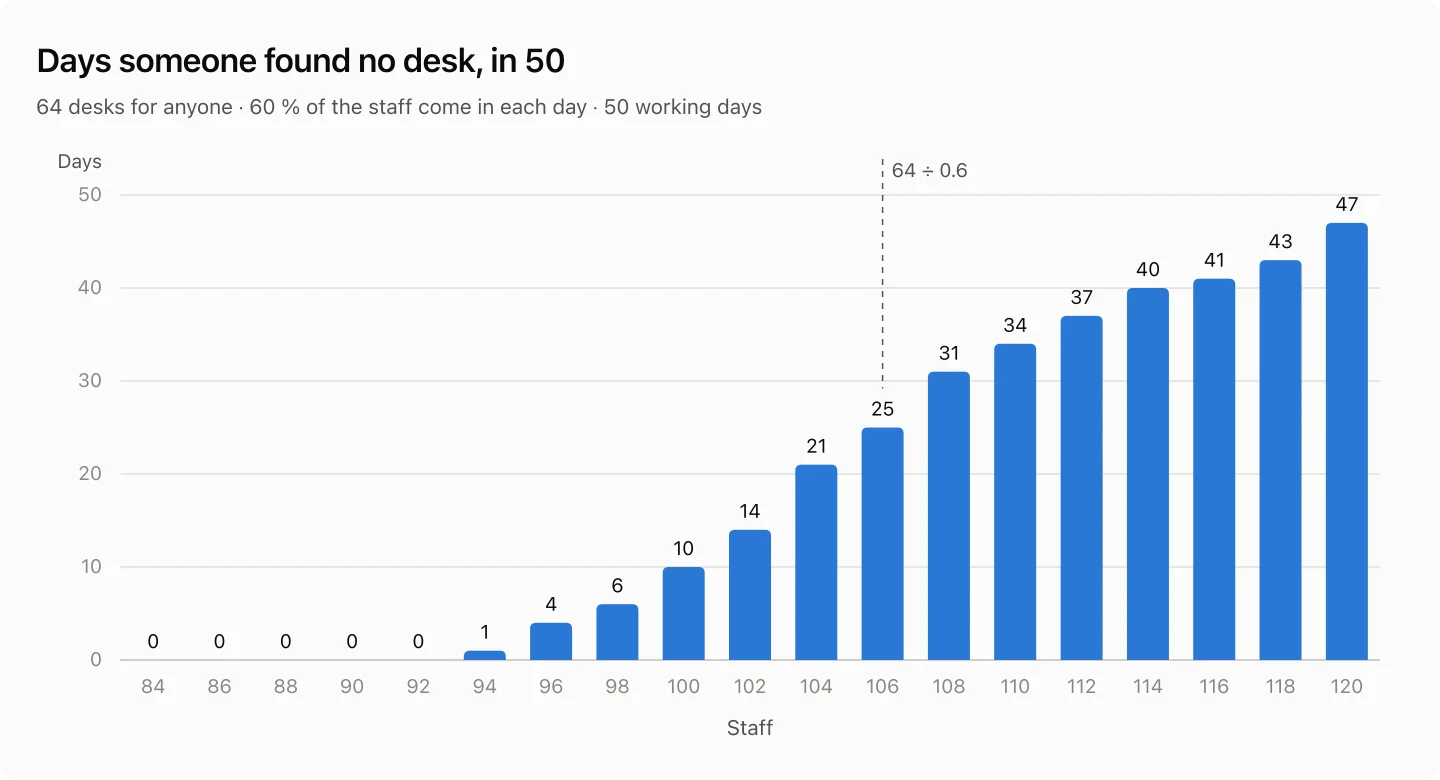
| Staff | In (mean of 50 days) | The busiest day | Days someone found no desk | Without a desk (the worst day) |
|---|---|---|---|---|
| 92 | 55.5 | 64 | 0 | 0 |
| 100 | 60.5 | 70 | 10 | 6 |
| 106 | 64.2 | 73 | 25 | 9 |
| 114 | 69.3 | 80 | 40 | 16 |
| 120 | 72.9 | 84 | 47 | 20 |
- With the desks as the staff times the share (64 ÷ 0.6, 106 staff), 64.2 come in on average, about the desks, yet someone finds no desk on 25 days of 50.
- No day ran short up to 92 staff: desks for 69.6 % of them.
- The number coming in changes from day to day. With 100 staff at 60 %, the chance that 65 or more come in is 17.9 % (the binomial distribution): about 9 days in 50, and 10 in the simulation.
3. The desks for each share coming in
| Coming in | Staff of 64 ÷ the share | Days someone found no desk | Staff with no day short | Desks ÷ staff | Chance a day runs short |
|---|---|---|---|---|---|
| 40 % | 160 | 25 | 128 | 50.0 % | 0.9 % |
| 50 % | 128 | 29 | 108 | 59.3 % | 2.1 % |
| 60 % | 106 | 25 | 92 | 69.6 % | 2.2 % |
| 70 % | 91 | 20 | 79 | 81.0 % | 0.9 % |
| 80 % | 80 | 23 | 73 | 87.7 % | 3.1 % |
- At every share, staff of 64 ÷ the share run short on about half of the 50 days.
- The more come in, the larger the share of desks: half the staff at 40 %, nearly nine in ten at 80 %.
- Even with no day short in 50, the binomial distribution gives a 0.9 to 3.1 % chance a day runs short (the last column).
4. With some in for half the day
At 60 % coming in, your AI changes the share of those coming in for half the day: half of them the morning (2.5 to 4.5 hours), half the afternoon (in 12:00 to 15:00 for 3 to 5 hours).
| Staff | In for half the day | Days someone found no desk | Without a desk (the worst day) |
|---|---|---|---|
| 106 | 0 % | 25 | 9 |
| 106 | 20 % | 8 | 7 |
| 106 | 40 % | 0 | 0 |
| 120 | 0 % | 47 | 20 |
| 120 | 20 % | 38 | 16 |
| 120 | 40 % | 10 | 9 |
- With four in ten of those coming in there for half the day, no day runs short even with 106 staff: those in the afternoon take the desks of those gone after the morning.
5. Using the check
- Draw your office’s desks (from a PDF drawing or photos as well), and tell your AI the staff, the share coming in and when they come and go.
- Not checked: desks left free for meetings, visits or lunch, teams coming in on the same days, the days of the week, desk booking, and the lockers.