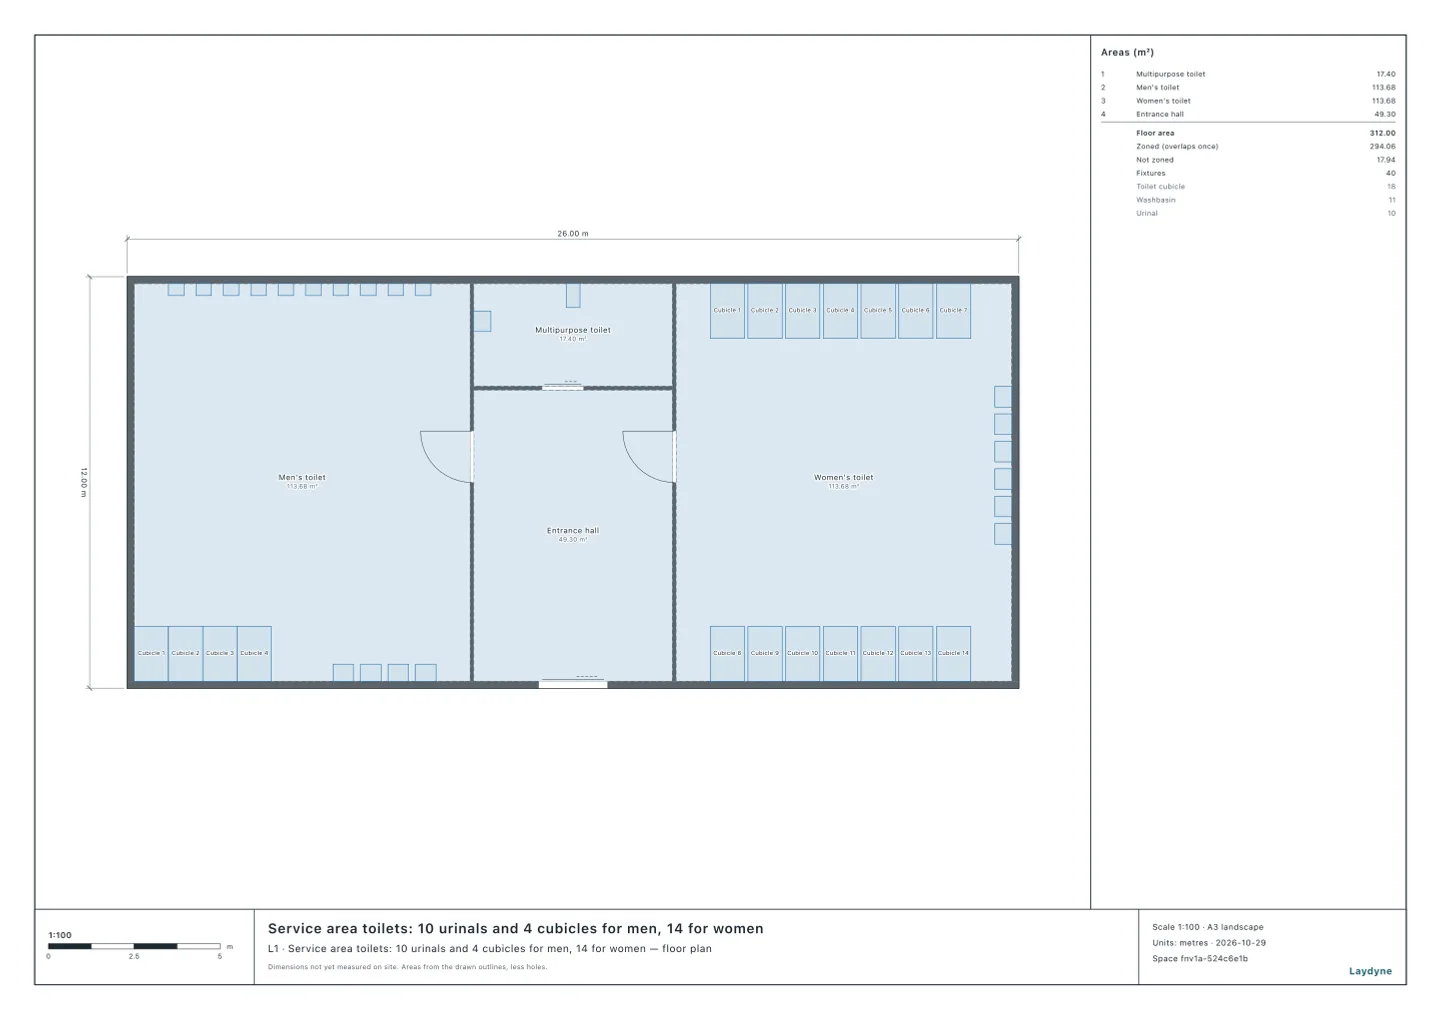
Start from the service area toilet block model (free sign-up; running a simulation is Pro). When a tour bus pulls in, some 40 people come to the toilets at once. In this article, in the members’ new model of a service area’s toilet block, your AI simulates the people who come by car and by tour bus. It ran the same tools an AI calls over MCP. Every figure and number below comes from that run.
1. The toilet block and the hour and a half
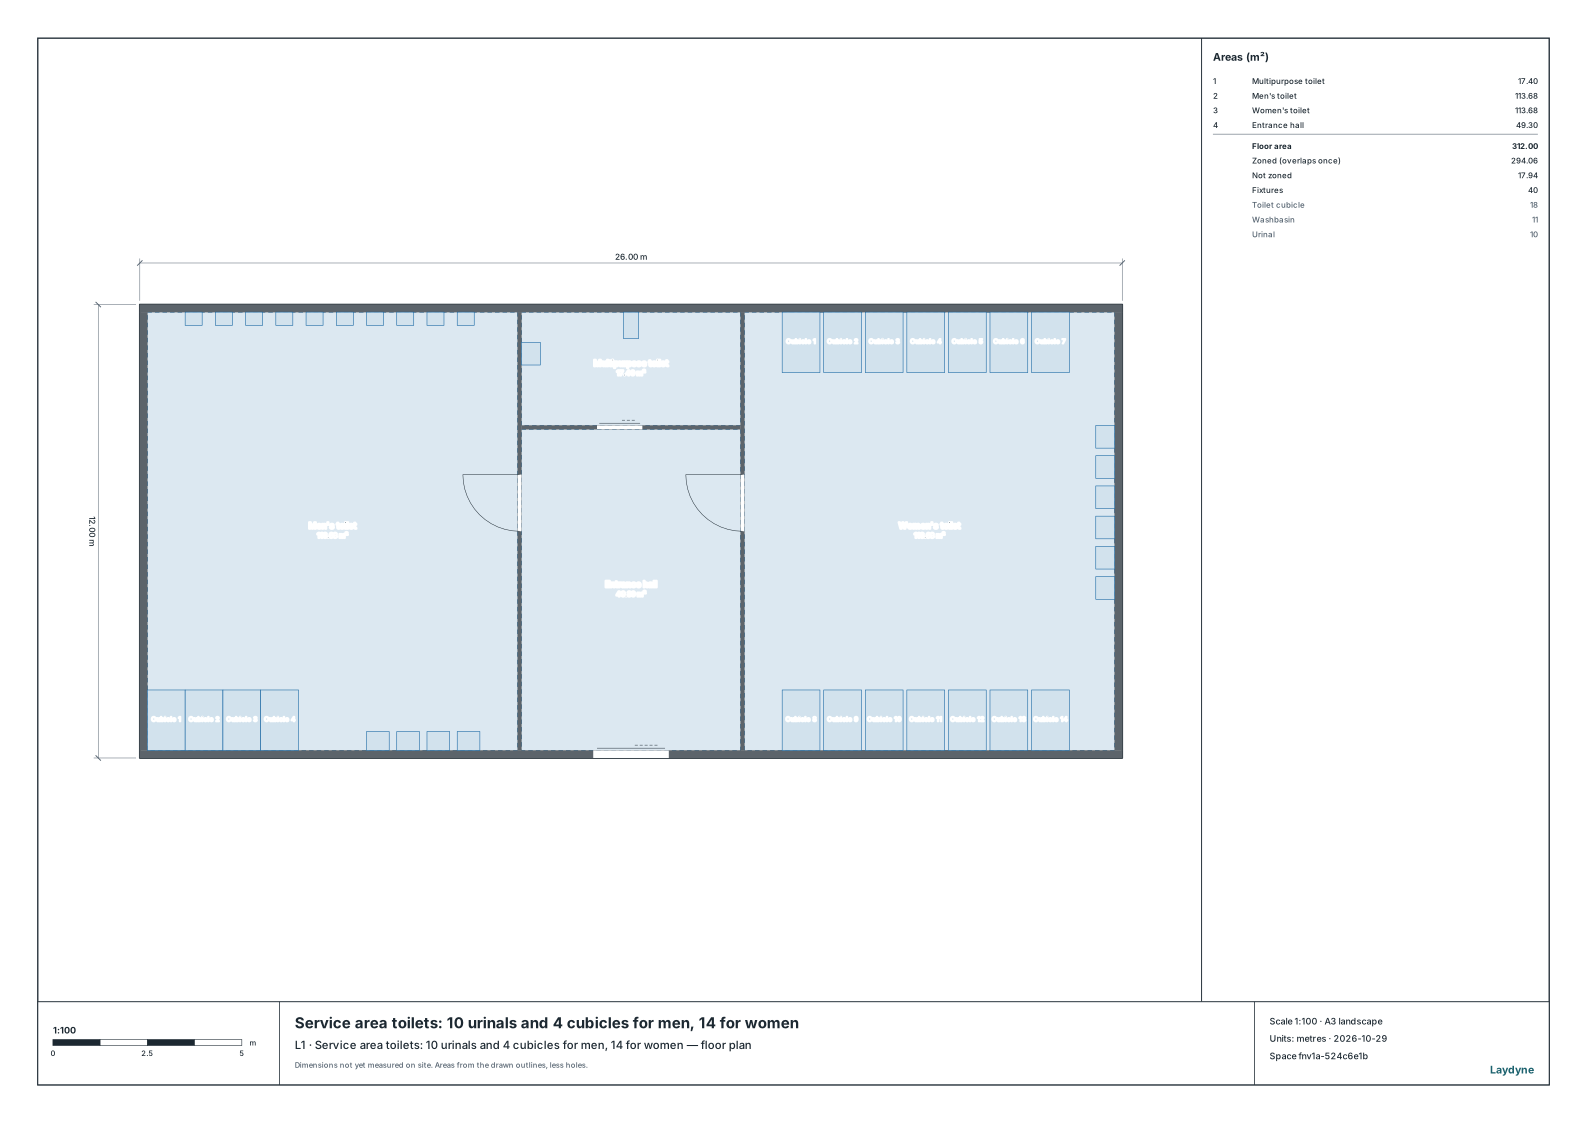
- A toilet block of 26 × 12 m with the men’s toilet (10 urinals, 4 cubicles, 4 washbasins), the entrance hall and a multipurpose toilet, and the women’s toilet (14 cubicles, 6 washbasins).
check_spacefinds nothing.
The AI wrote this flow as a scenario (put_process_scenario).
- For an hour and a half, 120 people an hour come by car and in at the entrance at random.
- Tour buses pull in one every 30 minutes from the 15th minute, and all 40 people of a bus come from the hall to the toilets. When they come in together, every bus pulls in at the 15th minute.
- 55 % are women. A woman uses a cubicle for 1 to 4 minutes (most often 1.5). Of the men, 85 % use a urinal for 30 to 75 seconds (most often 40), the others a cubicle for 2 to 6 minutes (most often 3).
- Then each washes their hands at a washbasin (10 to 30 seconds, most often 15) and goes out at the entrance.
- Every number and time is an assumption. Put in your own toilets’ records.
2. The buses and how they arrive
The AI changed the tour buses (1, 2, 3) and how they arrive (30 minutes apart, together) (sweep_process_parameters), 20 runs each. The women have 14 cubicles. The mean wait is over everyone, those who came by car included. The longest wait is the mean over the 20 runs of each run’s longest.
| Buses | Arrival | Women: wait (mean) | Women: longest wait | Women in line (most) | Urinals: longest wait |
|---|---|---|---|---|---|
| 1 | — | 0.2 min | 2.5 min | 12.4 | 0.7 min |
| 2 | 30 min apart | 0.3 min | 2.7 min | 13.6 | 0.9 min |
| 2 | Together | 1.0 min | 6.0 min | 33.7 | 2.0 min |
| 3 | 30 min apart | 0.4 min | 2.8 min | 13.7 | 1.0 min |
| 3 | Together | 2.0 min | 9.1 min | 53.9 | 3.5 min |
- With two buses 30 minutes apart, the women’s longest wait is 2.7 minutes. If they come in together, it is 6.0 minutes and the line is 33.7 at its most.
- With three buses together, the women’s longest wait is 9.1 minutes and the line 53.9. Thirty minutes apart, even three keep it to 2.8 minutes.
3. The women’s cubicles
With two buses, the AI changed the women’s cubicles in use (8, 10, 12, 14) and how the buses arrive.
| Arrival | Cubicles | Wait (mean) | Longest wait | In line (most) | In to out |
|---|---|---|---|---|---|
| 30 min apart | 8 | 1.1 min | 5.8 min | 19.9 | 4.2 min |
| 30 min apart | 10 | 0.7 min | 4.4 min | 17.7 | 3.8 min |
| 30 min apart | 12 | 0.5 min | 3.4 min | 15.6 | 3.6 min |
| 30 min apart | 14 | 0.3 min | 2.7 min | 13.6 | 3.4 min |
| Together | 8 | 2.4 min | 11.2 min | 39.9 | 5.5 min |
| Together | 10 | 1.7 min | 8.7 min | 37.8 | 4.8 min |
| Together | 12 | 1.2 min | 7.1 min | 35.7 | 4.3 min |
| Together | 14 | 1.0 min | 6.0 min | 33.7 | 4.1 min |
- Thirty minutes apart, even 8 cubicles keep the longest wait to 5.8 minutes: about the same as 14 when the buses come in together (6.0 minutes).
- When they come in together, 8 cubicles make the longest wait 11.2 minutes.
4. The share of women
With two buses and 14 cubicles, the AI changed the share of women (45, 55, 65 %) and how the buses arrive.
| Arrival | Women | Women who came | Women: wait (mean) | Women: longest wait | Urinals: longest wait | Men’s cubicles: longest wait |
|---|---|---|---|---|---|---|
| 30 min apart | 45 % | 119.1 | 0.2 min | 2.0 min | 1.2 min | 2.0 min |
| 30 min apart | 55 % | 144.1 | 0.3 min | 2.7 min | 0.9 min | 1.6 min |
| 30 min apart | 65 % | 170.5 | 0.5 min | 3.4 min | 0.7 min | 0.6 min |
| Together | 45 % | 119.1 | 0.7 min | 4.6 min | 2.6 min | 4.1 min |
| Together | 55 % | 144.1 | 1.0 min | 6.0 min | 2.0 min | 2.9 min |
| Together | 65 % | 170.5 | 1.3 min | 7.3 min | 1.4 min | 1.8 min |
- With 65 % women and two buses together, the women’s longest wait is 7.3 minutes.
- With 45 % women, when the buses come in together, the men’s cubicles’ longest wait is 4.1 minutes.
5. How to use this check
- Draw your own service area’s or roadside station’s toilets (from a PDF of the drawings or photos too), and tell your AI the buses and when they pull in, the people who come by car, the share of women and men, and how long each takes. Your AI also puts extra cubicles on the drawing and checks them.
- Not checked: the multipurpose toilet, those with children or older people who take longer, cubicles closed for cleaning, the walk from the bus to the toilets, and the flow to the shop or the food court.