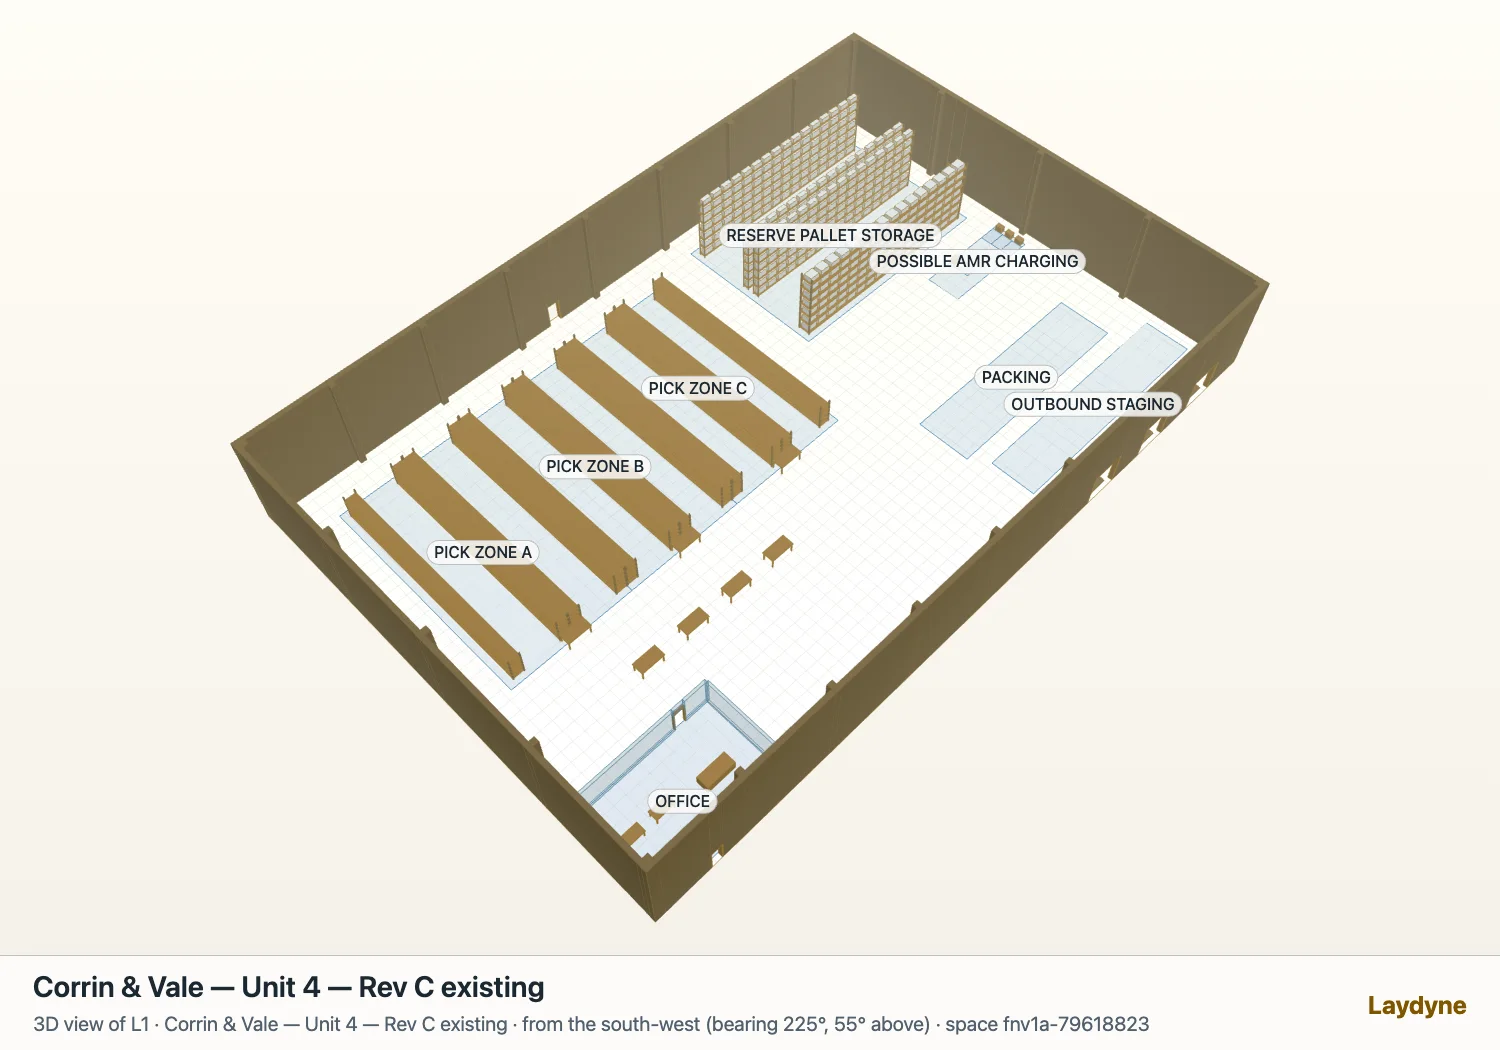
2026-10-07. An AI agent (Codex) drove Laydyne over MCP, as a user's own AI would. Every number comes from the runs; the list with sources is in facts.json. "Best" below always means the best of the candidates searched, not a proven optimum.
Who, and what they wanted
Three people had already used Laydyne to compare options by hand:
- A robot integrator's proposal engineer (the AMR proposal). The customer wants 110 orders an hour at peak. The engineer compared the customer's layout with four robots (option A) against moving the four packing benches south of the pick zones with three robots (option B), and proposed B.
- An event organiser at a 60 × 100 m exhibition hall. They compared three stage positions — at the far end, in the centre, near the entrance — for visitors' walking and waiting and for sight lines from the audience and a streaming camera.
- A designer working with a small clinic (the clinic proposal). They compared a shared reception counter for check-in and payment (option A) with a separate payment window (option B) on the doctor's busy-morning estimates.
Each picked between two or three options someone thought of. The question this time: if they say what may change, what to judge by and what must hold, can Laydyne build the candidates, run them all under the same conditions and rank them, and does the ranking agree with what people chose?
What Laydyne does now
search_layouts takes three things:
- What may change: parts moved as a block along a line, within an area or by offsets; turns; the spacing of a row; how many of a list of stations to keep; a scenario parameter such as a fleet or staff size; or a choice among whole arrangements.
- What to judge by: one measure the simulation already reports — waiting time, throughput, walking distance, a utilisation, a sight-line share — to minimise or maximise, with a second measure to break ties.
- What must hold: no new layout-check findings (overlaps, narrow passages, blocked doors, parts off the floor), areas to keep clear, parts that stay, thresholds on measured results.
Laydyne builds every candidate, rules out the ones that break a rule before running them, and runs the rest in the browser tab with the same seeds and number of runs as the current layout. It returns them best first, each with its 95 % interval and the paired difference from the current layout and from the best. When there are more candidates than the budget allows it samples them and refines around the best. The top few are saved as frozen layout options, so the ordinary comparison and its report take them up. The live layout does not change.
The Studio shows the search while the agent drives it: progress, a cancel, then the ranking, with a button that opens the saved options in the comparison.
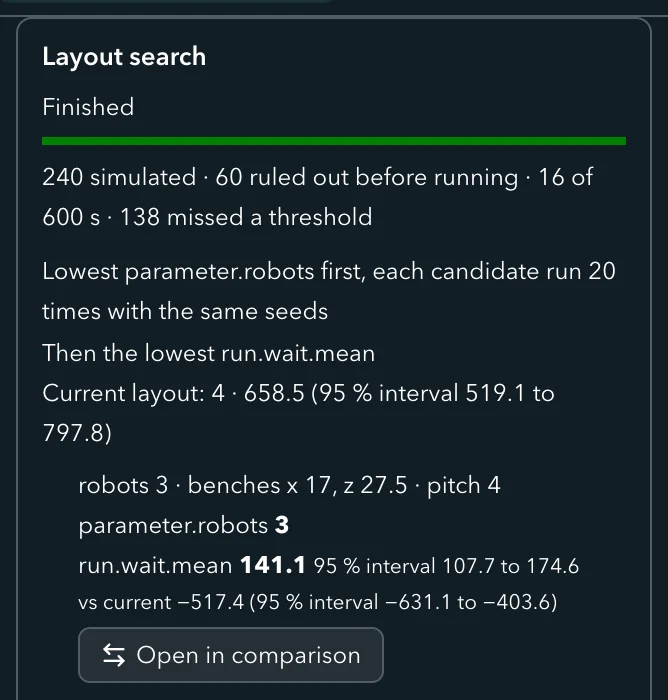
The top of the search card in the Studio's simulation panel, for the warehouse search of section 1 sent over MCP. An agent starts a search; the person reads and checks it here.
The flow, its tools and its outputs are in flow.json.
1. The warehouse: how many robots, and where the packing benches go
The engineer's request to their agent (excerpt; full prompt):
What may change: the number of robots (2, 3, 4 or 5); the four packing benches pack-1 to pack-4 as one block, with its centre anywhere on the aisle line z = 27.5 m from x = 5 to x = 53 m in 2 m steps; and the spacing of the benches (4, 5.5 or 7 m centre to centre). Keep clear: the office and the outbound staging lane. No new layout-check problems. The peak must still reach 110 orders an hour. Goal: the fewest robots; among those, the lowest average wait. The same 20 runs and seed as the proposal, so the numbers line up with Option B.What Laydyne searched. 4 fleet sizes × 25 positions × 3 spacings = 300 candidates. 60 were ruled out before running: 52 put a bench off the floor, 8 overlapped a wall or rack. The other 240 ran 20 times each (4,800 simulated peaks plus the current layout) in 19 seconds in the browser tab; 138 of them missed the throughput threshold.
What it found. Three robots, the bench row centred at x = 17 m, benches 4 m apart. The same row centred at x = 15 m was second and within the noise of the first. Option B, chosen by hand, had three robots and the benches 7 m apart around x = 17.5 m: the search agrees on the fleet and the place, and closes up the row.
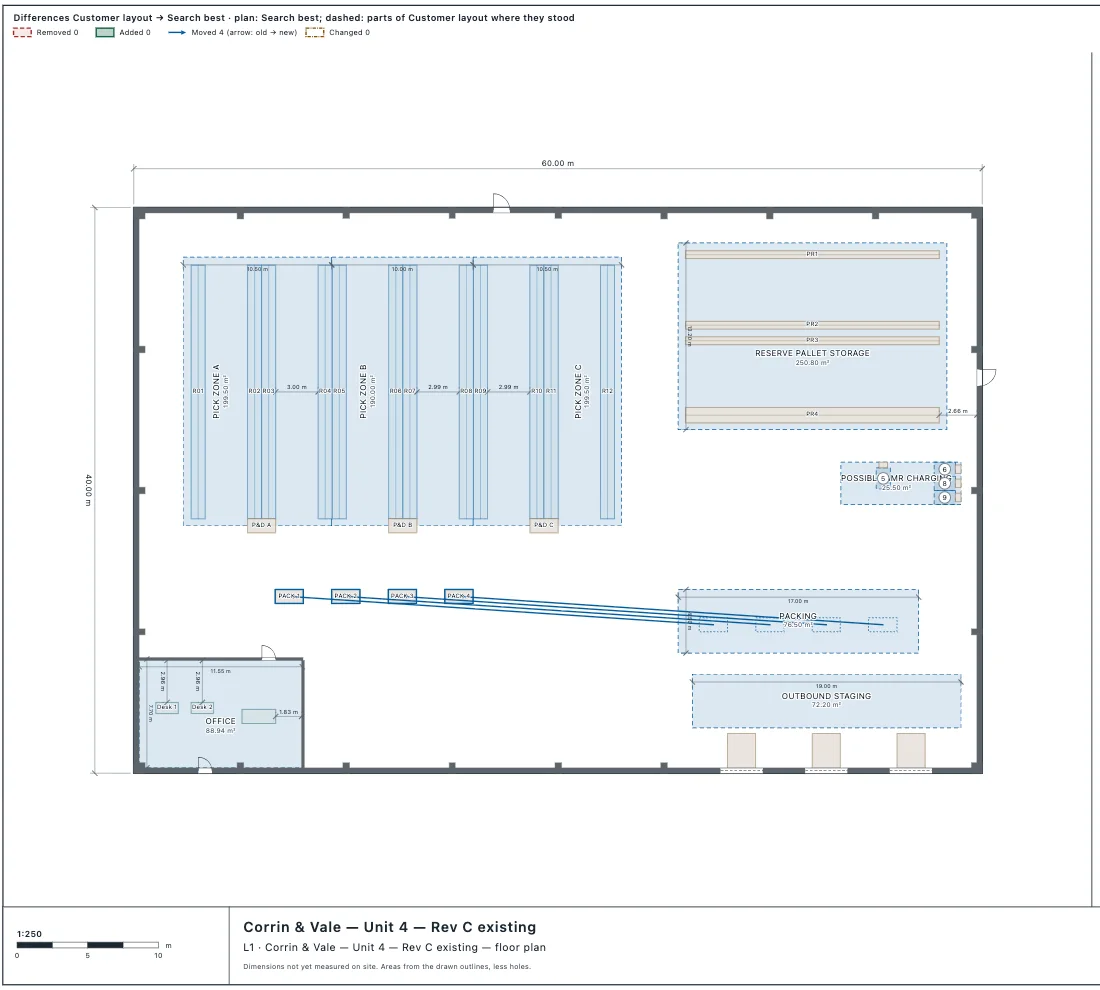
Drawn by get_view_image with the differences from the customer's layout. The agent applied the candidate to draw it and then restored the customer's layout.
| 20 peak runs, mean (95 % interval) | A: customer layout, 4 robots | B: hand-made, 3 robots | Search best, 3 robots |
|---|---|---|---|
| Bench row | x ≈ 41–53 m, 4 m apart | x ≈ 7–28 m, 7 m apart | x ≈ 11–23 m, 4 m apart |
| Customer orders packed an hour | 99.7 (99.1–100.3) | 109.0 (106.5–111.5) | 109.3 (106.8–111.8) |
| Mean wait of a job (s) | 658.5 (519.1–797.8) | 163.5 (122.7–204.3) | 141.1 (107.7–174.6) |
| Robot travel, whole fleet, 2.5 h (km) | 15.45 | 5.68 | 4.97 |
Paired on the same seeds, the search's best against B: wait −22.4 s (−31.0 to −13.8), robot travel −708 m (−764 to −653), customer orders +0.34 an hour (0.11 to 0.57). All three are beyond the noise; the throughput gain is too small to matter.
What it could not establish. The threshold in the request was on the simulation's throughput, which counts every completed job, and this scenario models charging as about three jobs an hour (the AMR article footnoted this). The agent noticed, ran each of the 20 seeds on its own with the full job records and counted only the customer orders completed in the observation window (the totals of all jobs matched the search's to the decimal): neither B nor the search's best reaches a mean of 110 customer orders an hour, though both intervals include 110. It also searched the same 300 candidates for the highest throughput; the leader, with five robots, packed 109.5 customer orders an hour. So the search says where the benches should go and that the fleet is not the limit; it does not say that 110 orders an hour is reachable in this model. The earlier article's bench assumption (a bench is reserved from dispatch until packing ends) is still the first thing to check with the customer.
2. The exhibition hall: where the stage goes, and how wide the aisles are
The organiser's request (excerpt; full prompt):
Where the stage goes: in any of the three zones (the far end, the centre, near the entrance, as in the saved arrangements, with the booths in the other two zones), and shifted sideways by −8, −4, 0, 4 or 8 m. How wide the cross aisles between the booths are: try 0.9, 1.2, 1.5 and 1.8 m. Sight lines must hold: everyone in the audience zone sees the whole stage front, and our streaming camera sees at least 99 % of it. No new layout-check problems. Goal: the least walking in total; among equals, the lowest average wait. The same 3 runs and seed 7 as before.What Laydyne searched. The agent wrote the 3 arrangements × 4 aisle widths as 12 whole arrangements (it read the hand-made ones from the saved design options and computed the booth positions for each width) and the sideways shift as offsets: 60 candidates. None broke a layout rule. 40 failed the sight lines and were ruled out before running: every centre and entrance candidate. The 20 far-end candidates ran 3 times each, in 19 seconds.
What it found. The stage at the far end, shifted 4 m west, with the aisles left at 0.9 m. The top five were all at the far end with 0.9 m aisles, at different shifts, and all within the noise of each other; every candidate with wider aisles ranked lower.
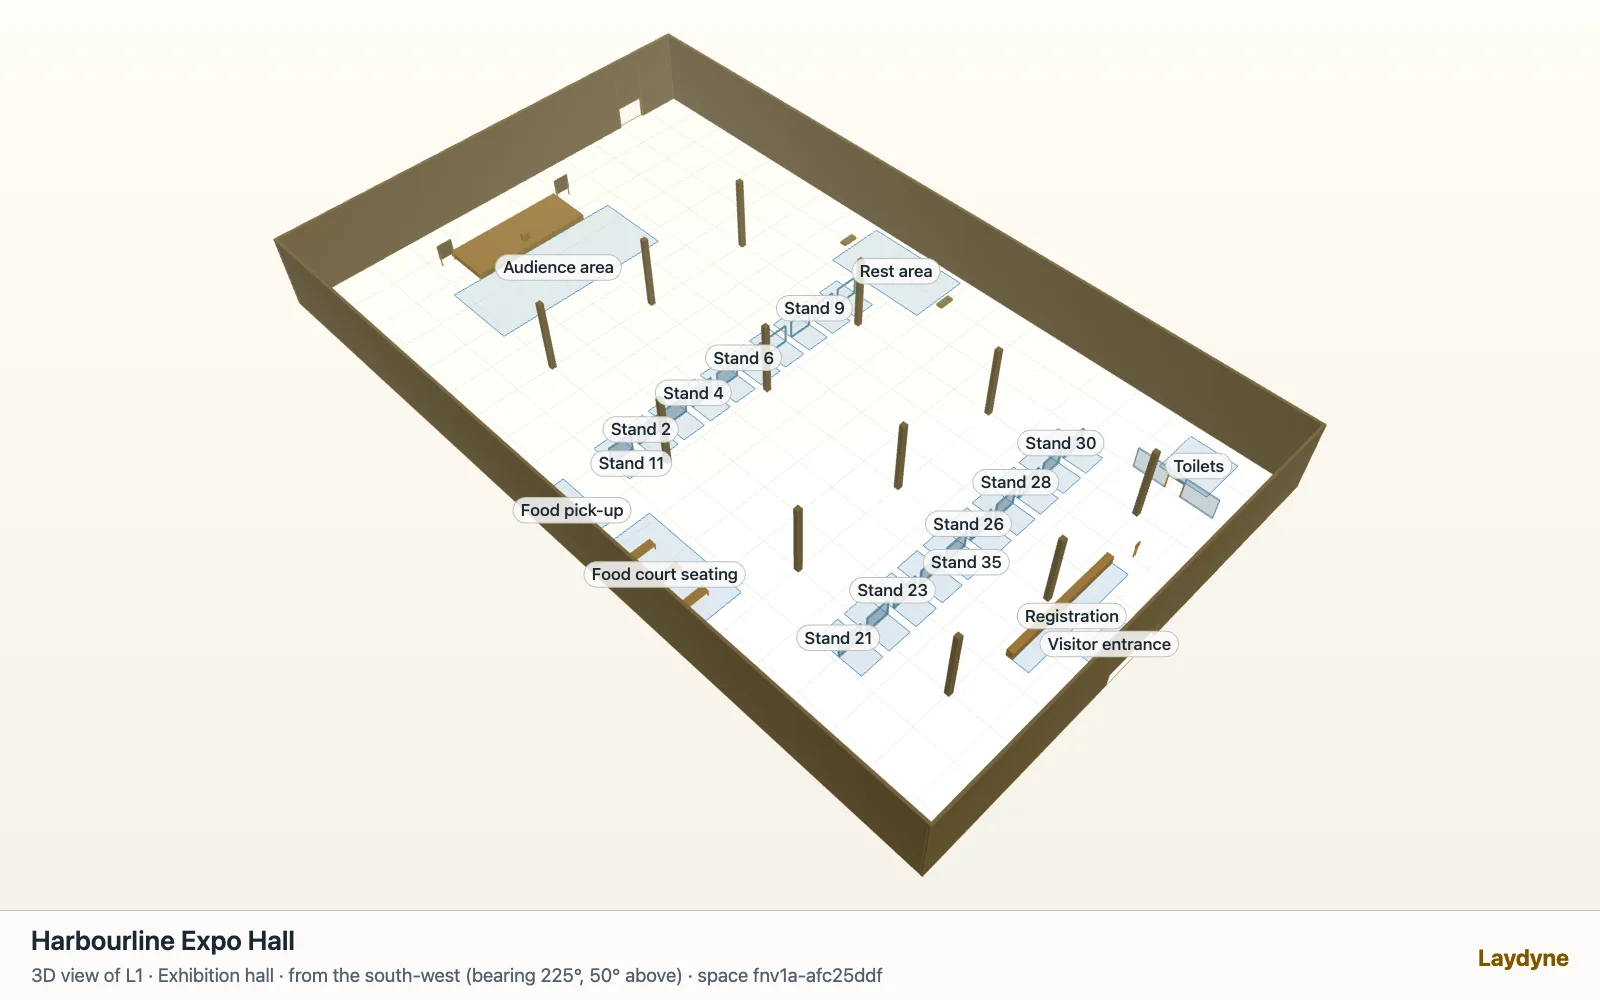
The far-end arrangement with the stage set 4 m west and 0.9 m aisles, from the project the agent saved (we drew this view afterwards; the agent showed it in 2D).
| 3 runs, mean (95 % interval) | Audience sees the whole front / camera sees | Total walking (km) | Mean wait (s) |
|---|---|---|---|
| Hand-made: far end | 100 % / 100 % | 123.34 (106.13–140.55) | 171.9 (122.9–220.8) |
| Hand-made: centre | 64.2 % / 71.0 % | 150.41 (130.60–170.21) | 176.1 (123.4–228.8) |
| Hand-made: near the entrance | 100 % / 67.7 % | 150.48 (130.52–170.44) | 168.1 (117.7–218.5) |
| Search best: far end, 4 m west | 100 % / 100 % | 123.11 (106.19–140.04) | 172.0 (123.6–220.4) |
Paired against the hand-made far end: walking −0.22 km (−0.83 to +0.38) and wait +0.10 s (−1.16 to +1.36), both within the noise. Against the centre and the entrance, 27 km less walking in total, beyond the noise; against the entrance the wait is 3.9 s longer (1.1 to 6.6), also beyond it. The search confirms the hand-made choice and shows that nothing in the space searched does better on these measures. With three runs the intervals are wide; that is the earlier comparison's choice, kept here so the numbers line up.
3. The clinic: staff split and the payment counter
The designer's request (excerpt; full prompt):
The doctor asks: without hiring anyone (2 receptionists and 2 nurses today; the 2 doctors stay), what is the best way to cut the time from arriving to leaving? Let Laydyne search it instead of us guessing: how the four front-desk and nursing staff are split (each at least 1, together at most 4), and whether payment shares the counter (layout A) or has its own window (layout B). Goal: the shortest average time from arriving to leaving. The same 20 mornings and seed. And how many waiting chairs the best needs, against the 20 chairs we have.What Laydyne searched. The saved mornings had fixed staff numbers, so the agent first turned them into parameters (receptionists and nurses on layout A; check-in staff, payment staff and nurses on layout B), keeping everything else. A search cannot switch between two scenarios, so it ran one search per front-desk layout, with the staff total as a rule checked before running: on A, 9 splits, 3 over the total, 6 run; on B, 8 splits, 4 over, 4 run. Each candidate ran the 20 mornings; the two searches took 0.4 s and 0.3 s.
What it found. The best split on both layouts was today's: two receptionists and two nurses. On A, the search's best is the hand-made option A itself; on B, it is option B. The two are tied on the time from arriving to leaving (B minus A: +0.27 s, −11.8 to +12.3, within the noise), so the search confirms the earlier comparison: B moves waiting from check-in to the doctor, it does not shorten the visit.
| 20 mornings, minutes, mean (95 % interval) | Option A: shared counter, 2 + 2 | Option B: payment window, 1 + 1 + 2 nurses |
|---|---|---|
| Arrive to leave | 48.8 (41.7–55.9) | 48.8 (41.7–55.9) |
| Wait to check in | 0.29 (0.22–0.36) | 1.89 (1.33–2.46) |
| Wait for a doctor | 29.5 (22.9–36.1) | 28.3 (22.1–34.5) |
| Wait to pay | 0.14 (0.11–0.17) | 0.20 (0.17–0.23) |
| Most people in the waiting area at once, mean of the mornings | 15.1 (12.2–18.0) | 14.7 (11.9–17.5) |
The other splits on A, against today's (paired, same mornings): three receptionists and one nurse add 21 s to the visit (4 to 37 s); two and one add 29 s (13 to 45 s); with one receptionist the visit is 5.6 minutes longer (3.9 to 7.4), because check-in waits grow by 6.9 minutes while the doctors' queue shortens by 6.3. All are beyond the noise and all are worse. The doctors stay the limit: the wait for a doctor is 29.5 of the 48.8 minutes, and no split of the other four staff changes that.
Chairs. The agent asked for the waiting-area peak of every morning in one call (perRun, new today): 10, 22, 18, 12, 32, 6, 19, 22, 8, 21, 10, 19, 14, 13, 10, 13, 15, 15, 14, 9. The mean peak is 15, but 4 mornings of 20 need more than the 20 chairs, one of them 32. The designer has a number to discuss with the doctor: more chairs, or appointments that smooth the 9:00 rush.
What it cost
| Warehouse | Hall | Clinic | |
|---|---|---|---|
| Agent | Codex CLI 0.160.1 | Codex CLI 0.160.1 | Codex CLI 0.160.1 |
| Model, reasoning effort | gpt-6.1-sol, max | gpt-6-astra, xhigh | gpt-6-astra, xhigh |
| Time | 47 min 42 s | 7 min 6 s | 6 min 11 s |
| Tool calls (failed) | 245 (5) | 40 (5) | 30 (3) |
| Input tokens (cached) | 4.56 M (4.36 M) | 2.36 M (2.23 M) | 1.49 M (1.36 M) |
| Output tokens (reasoning) | 51,877 (35,065) | 10,996 (3,628) | 8,566 (2,760) |
| Time in the searches themselves | 19 s | 19 s | 0.6 s |
The model was changed after the first run at the user's request, so the three columns are not a like-for-like comparison of models or tasks. Most of the warehouse run's time and calls went into its own audit of customer orders: 80 scenario writes and 80 single runs, one seed at a time, because no measure counts the completions of one process in the observation window. The searches themselves took seconds.
Most failed calls were the agent finding the search's input format. Codex shows the model each tool's inputs as a type signature, and it rendered the list of changes — a choice among six kinds — and the parts of the schema the server shares between fields as unknown. In the warehouse run the agent guessed {type, key, ids, line} three times before reading the right names from the errors. After that run we made a change without a kind answer with every kind, its fields and an example, and put one example request in the tool's description. In the hall and clinic runs the first error led straight to the right kinds; the remaining failures were other fields Codex also showed as unknown (the camera's aim, the audience zone, and offsets, which take an object rather than a list), a request for more than five results, and, in the clinic, an attempt to choose between two scenarios inside one search, which the search cannot do.
For scale, the search in the browser tab is not the slow part: the warehouse grid of 300 candidates × 20 runs took 16.3 s when we sent the same request directly (19 s inside the agent's run), against 23.2 s in Node.
What is not calculated
- The searches only cover the candidates described. Ranges, steps, seeds and the number of runs outside them are not tested; a sampled search does not try everything.
- Robots: no collision avoidance, crossing traffic, congestion slowing, acceleration or battery physics; charging is a scheduled hold. Picking and outbound loading are outside the model.
- Hall: no crowding or density slowing, no people blocking the view; sight lines are the drawn obstacles only.
- Clinic: the arrival and service times are the doctor's rough guesses, not measurements.
- The intervals describe variation over the tested seeds. Choosing the best of many candidates on the same seeds favours the luckiest one a little; re-run the chosen option on new seeds before relying on a small difference.
Files
- Projects after the runs (Laydyne project JSON, with the saved options and comparisons): warehouse, hall, clinic.
- Search results as the agent received them: warehouse, hall, clinic. The warehouse's customer-order audit: amr-order-audit.json.
- The prompts: warehouse, hall, clinic. Every number in this article with its source: facts.json.