Retail & venues / WORKED EXAMPLE
Café morning peak
See whether the tills or the espresso bar hold up a café’s morning peak.
Free to open, edit and save a file. Pro to run your changes. Opening a project asks before replacing your current space.
Is a second barista or a quicker order the better fix for the morning queue?
- Who uses it
- Café owners and store managers
- How it can create value
- Compare staffing the bar with speeding up ordering (a menu board, pre-orders) before changing the rota. Weigh each wait reduction against its labour cost and your service target; shorter waits alone do not establish extra sales.
- Bring your site data
- Arrivals per 15 minutes, observed order and drink times, the share of drinks and takeaway, staff on shift and labour costs. Walk-aways and seat turnover need observed data.
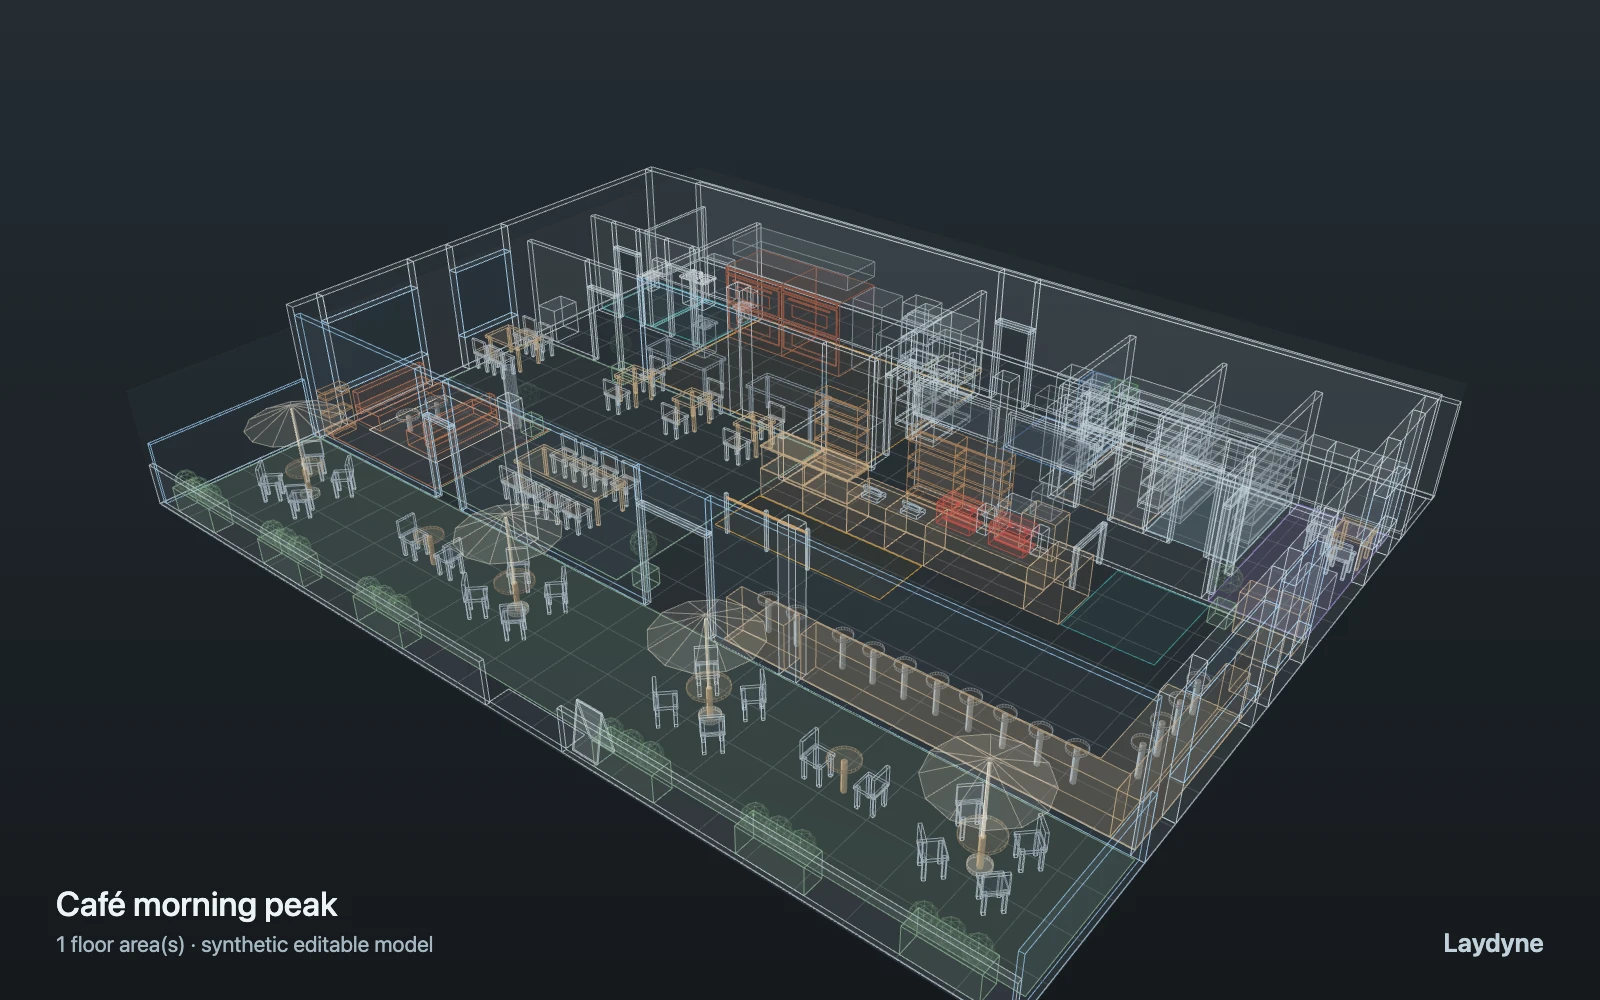
01 / SETUP
A model you can inspect.
Guests arrive from the street at random (poisson) for 40 minutes, queue, order at the free till (else the shorter line), wait at pickup while a shared barista makes their drink at the free espresso machine, then sit or leave; a baker puts a batch in the free deck oven every ten minutes for half an hour and restocks the bread shelves. The shares of drinks, takeaway and seating areas are assumptions, a guest takes the nearest seat of the area nobody sits at or walks to, and nobody walks away from a long queue. Waits are counts and times per resource, not crowd movement, and nothing here predicts sales.
Change one thing
With the same 90 guests per hour, compare 1 and 2 baristas, then a 40 s and a 60 s order at the till. A third barista adds nothing while there are two machines.
Read the consequence
The queue and pickup waits, which till and machine are working, and the oven batches. Shares of drinks, takeaway and seating areas are assumptions; walk-aways and sales are not modelled.
View the starting inputs
- Guests per hour
- 90
- Baristas on the bar
- 2
- Order time at the till (s)
- 40
Agent counts, routes and resource definitions are also saved in the project JSON.
02 / ACTUAL ENGINE OUTPUT
A reproducible starting result.
One run, seed 1. Observation window 60 minutes.
| Scenario | Completed | Mean wait | Mean cycle | Blocked |
|---|---|---|---|---|
| Original scenario | 69 | 19s | 11m 04s | 0 |
Waiting averages cover arrived jobs, including unfinished waits; cycle averages cover completed jobs only. These are synthetic calculations, not measured store performance, revenue or a safety assessment.
Engine, status and output notes
process-des-2.2.0. Status: Original scenario: completed. “Completed” is the engine run status; check the blocked column for unreachable jobs.
- No engine warnings.
Engine inputs and saved comparisons stay with the downloaded project. Any limited trace affects playback details, not aggregate metrics.
03 / MAKE IT YOURS
Plan in 2D. Inspect in 3D. Keep the whole project.
- Open and adjust. Switch between 2D and 3D; edit a part, a floor or an input. Both views describe the same model.
- Connect your agent for free. Sign in, choose Connect AI and connect Codex or Claude Code. Ask it to inspect the example, edit the layout and check a route.
- Save a checkpoint. Export → Project JSON, or ask the agent to export the complete project. Import it later to restore floors, scenarios, saved comparisons and the selected view.
- Compare with Pro. Run an edited scenario or compare frozen options under the same demand. Pro also adds built-in AI and manual cloud saving.