Factory & warehouse / WORKED EXAMPLE
Robot picking shift
See whether the pick stations or the robot fleet limit a goods-to-person picking shift.
Free to open, edit and save a file. Pro to run your changes. Opening a project asks before replacing your current space.
Will more robots raise throughput, or are the pick stations already the limit?
- Who uses it
- Warehouse operations managers and automation planners
- How it can create value
- Before ordering more robots, see whether the modelled stations are already near saturation, and compare that with faster picks or fewer order lines per hour. Weigh any gain in orders per hour against robot, station and labour cost; the model does not forecast order volume or sales.
- Bring your site data
- Order lines by hour, measured pick time per pod visit and pack times, robot speed and the fleet in service, and the station and bench count. Validate robot traffic, charging, pod slotting and conveyor capacity with the vendor’s simulator or site data before sizing a fleet.
01 / SETUP
A model you can inspect.
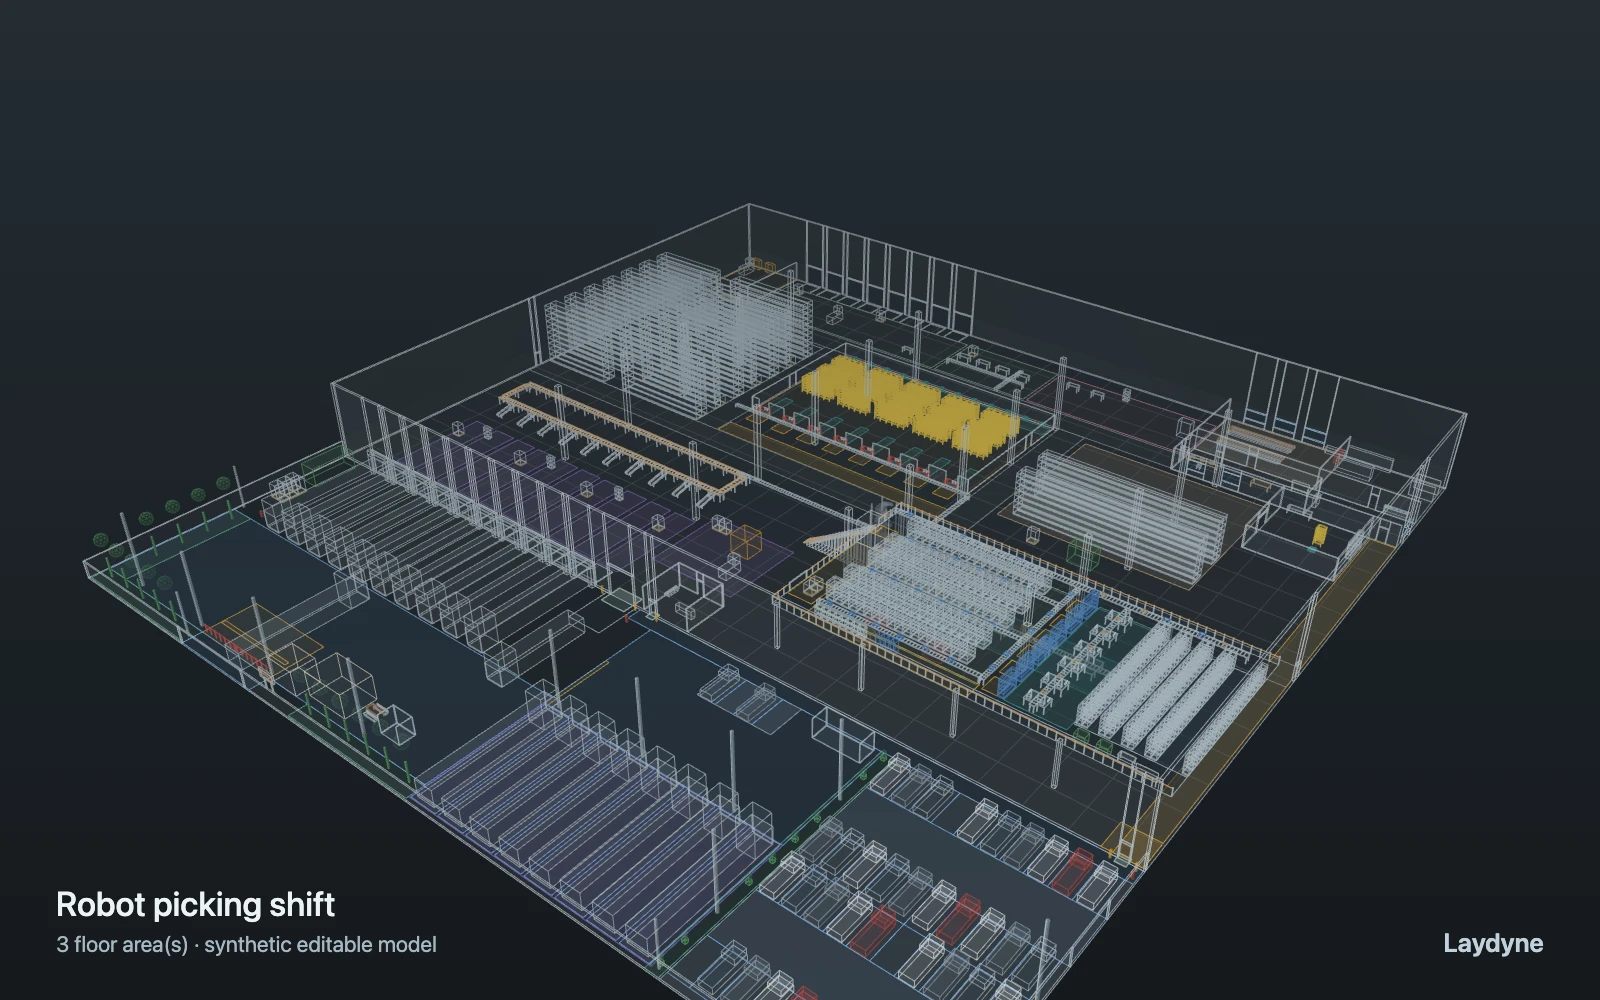
Order lines arrive for 30 minutes (poisson, 1,000 per hour). One of the 32 drive units in service (of a 40-robot fleet) lifts one of 24 pods and, at the station approach, takes a free one of eight goods-to-person stations (robots still driving to a lane count as taking it; in turn when several are free, else the lane with the fewest ahead); it queues in that lane, the picker works 24 s plus 2–12 s, and the pod goes back to its place. The item then rides the conveyor to a free one of twelve pack benches and on to the sorter, while two forklifts put away inbound pallets and six mezzanine pickers pick fast movers for six put walls and fetch cartons by the goods lift. Routes, service times and FIFO queues only: no robot traffic or collisions, charging, pod slotting, order batching, conveyor accumulation or trailer loading.
Change one thing
With the same orders, compare 16, 24 and 32 robots in service; then cut the pick time from 24 to 16 s, or the orders from 1,000 to 800 per hour.
Read the consequence
Robots queued in each station lane, station and bench states, the order cycle time and the wait for a free robot: beyond about 24 robots the wait only moves from the fleet to the station lanes. Robot traffic, collisions, charging and battery swaps are not modelled.
View the starting inputs
- Order lines per hour
- 1000
- Robots in service (of 40)
- 32
- Pick time per pod visit (s)
- 24
Agent counts, routes and resource definitions are also saved in the project JSON.
02 / ACTUAL ENGINE OUTPUT
A reproducible starting result.
One run, seed 3. Observation window 40 minutes.
| Scenario | Completed | Mean wait | Mean cycle | Blocked |
|---|---|---|---|---|
| Original scenario | 634 | 20s | 3m 25s | 0 |
Waiting averages cover arrived jobs, including unfinished waits; cycle averages cover completed jobs only. These are synthetic calculations, not measured store performance, revenue or a safety assessment.
Engine, status and output notes
process-des-2.2.0. Status: Original scenario: completed. “Completed” is the engine run status; check the blocked column for unreachable jobs.
- Timeline output is limited to 200 jobs and 10000 entries. Aggregate metrics include all jobs.
Engine inputs and saved comparisons stay with the downloaded project. Any limited trace affects playback details, not aggregate metrics.
03 / MAKE IT YOURS
Plan in 2D. Inspect in 3D. Keep the whole project.
- Open and adjust. Switch between 2D and 3D; edit a part, a floor or an input. Both views describe the same model.
- Connect your agent for free. Sign in, choose Connect AI and connect Codex or Claude Code. Ask it to inspect the example, edit the layout and check a route.
- Save a checkpoint. Export → Project JSON, or ask the agent to export the complete project. Import it later to restore floors, scenarios, saved comparisons and the selected view.
- Compare with Pro. Run an edited scenario or compare frozen options under the same demand. Pro also adds built-in AI and manual cloud saving.