Retail & venues / WORKED EXAMPLE
Saturday afternoon
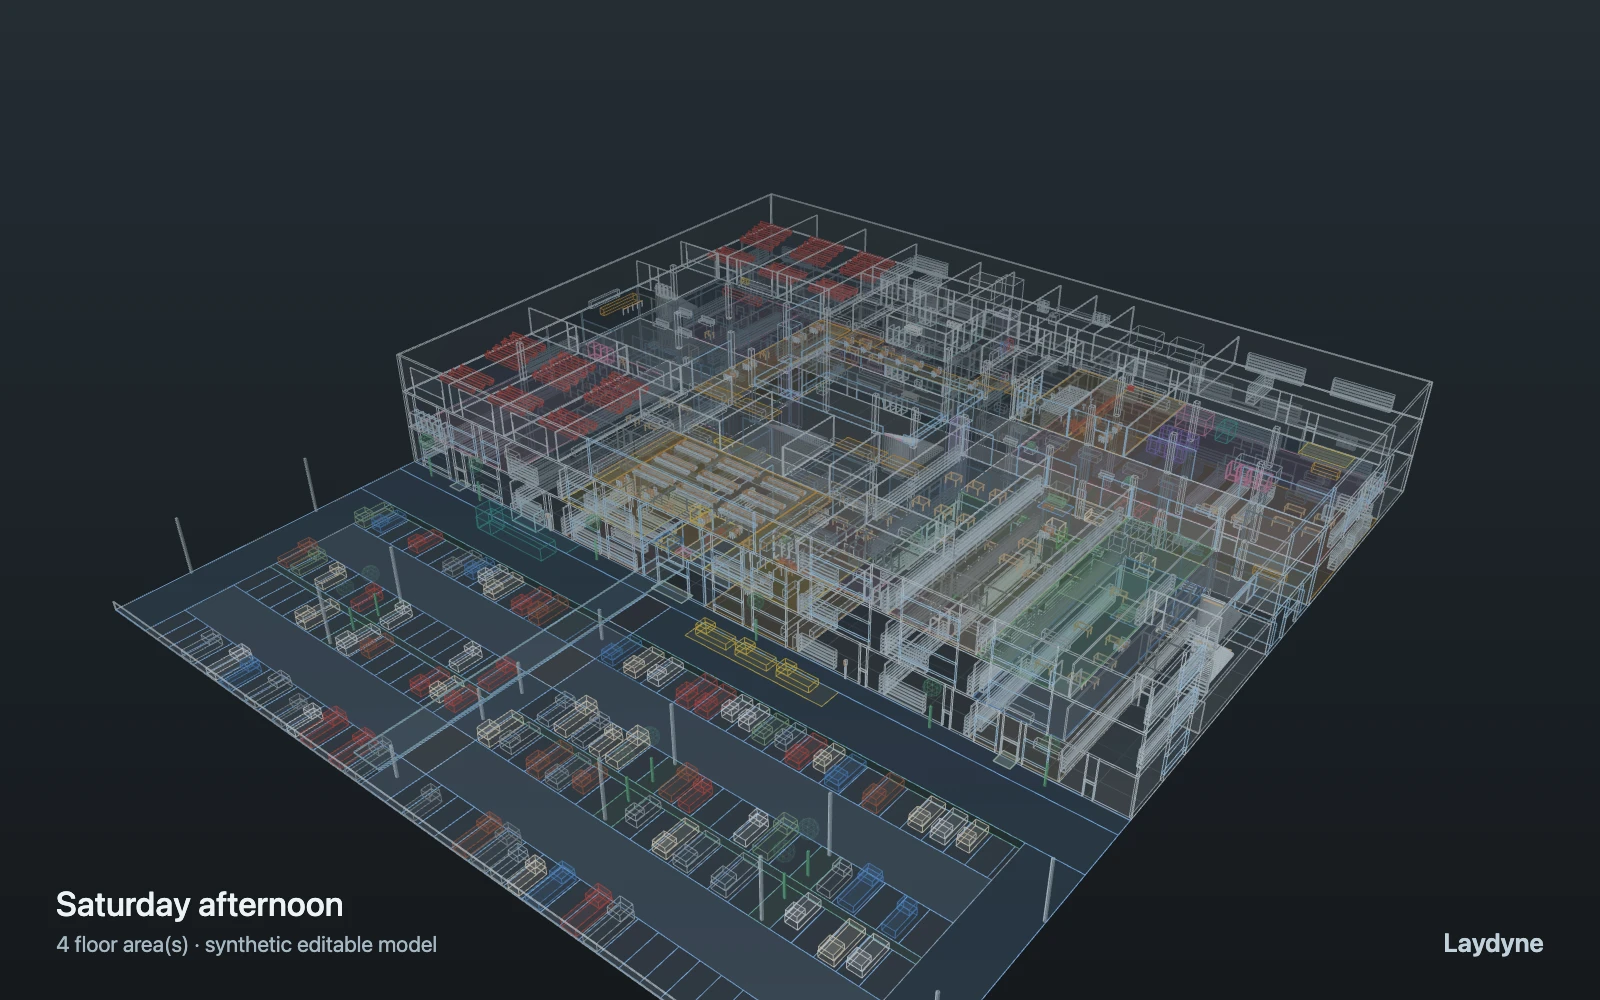
Watch a Saturday afternoon on all three levels and see where the food court queues.
Free to open, edit and save a file. Pro to run your changes. Opening a project asks before replacing your current space.
At a Saturday peak, which food-court stalls queue, and does faster cooking or a smaller food-court share clear the queues?
- Who uses it
- Shopping-centre operations managers and food-court tenants
- How it can create value
- See where visitors wait before changing stall staffing, menus or the food-court layout, and check the effect of a film letting out. Shorter queues alone do not establish extra sales; weigh them against staff hours.
- Bring your site data
- Visitor counts by hour and entrance (car park, bus, step-free), the share visiting the food court and cinema, measured order and cooking times per stall, film end times and seat counts. Real stall choice, balking and group sizes need observation before trusting queue lengths.
01 / SETUP
A model you can inspect.
Visitors arrive by car (poisson, 360 per hour for 15 minutes), by shuttle bus (three groups of 8) and step-free by lift (40 per hour), shop on 1–3 random levels and then go to the food court (45 %), the cinema (10 %: ticket, snacks, a seat until the film starts) or home, some via the restrooms (each at a free place inside), while 40 people leave an earlier film at 10 minutes and two porters deliver by the service lift. A diner picks a kind of food, then a free stall of that kind (counting diners already walking there; in turn when both are free, else the one with the fewest ahead, judged from the atrium); each stall takes and cooks one order at a time (exponential cooking time, mean 120 s). Walking, fixed capacities and FIFO queues only: no crowd physics, balking, queue switching, lift cars, group visits or sales.
Change one thing
Cut the mean cooking time from 120 to 90 s, or move the food-court share from 45 to 30 or 60, with the same visitors.
Read the consequence
Queues at each stall counter and whether they clear, waits after the film lets out, seats in use and escalator traffic. Sales, balking, queue switching and physical crowding are not modelled.
View the starting inputs
- Visitors by car per hour
- 360
- Share going to the food court (weight)
- 45
- Share going home after shopping (weight)
- 45
- Mean cooking time at a stall (s)
- 120
Agent counts, routes and resource definitions are also saved in the project JSON.
02 / ACTUAL ENGINE OUTPUT
A reproducible starting result.
One run, seed 5. Observation window 60 minutes.
| Scenario | Completed | Mean wait | Mean cycle | Blocked |
|---|---|---|---|---|
| Original scenario | 172 | 1m 16s | 19m 28s | 0 |
Waiting averages cover arrived jobs, including unfinished waits; cycle averages cover completed jobs only. These are synthetic calculations, not measured store performance, revenue or a safety assessment.
Engine, status and output notes
process-des-2.2.0. Status: Original scenario: completed. “Completed” is the engine run status; check the blocked column for unreachable jobs.
- No engine warnings.
Engine inputs and saved comparisons stay with the downloaded project. Any limited trace affects playback details, not aggregate metrics.
03 / MAKE IT YOURS
Plan in 2D. Inspect in 3D. Keep the whole project.
- Open and adjust. Switch between 2D and 3D; edit a part, a floor or an input. Both views describe the same model.
- Connect your agent for free. Sign in, choose Connect AI and connect Codex or Claude Code. Ask it to inspect the example, edit the layout and check a route.
- Save a checkpoint. Export → Project JSON, or ask the agent to export the complete project. Import it later to restore floors, scenarios, saved comparisons and the selected view.
- Compare with Pro. Run an edited scenario or compare frozen options under the same demand. Pro also adds built-in AI and manual cloud saving.