A flexible membership gives access to shared desks. Members may skip a day, leave after the morning or arrive after lunch, so a desk can serve different people during the same day. For an operator selling memberships, the useful question is how often a member arrives and cannot get a desk.
With 50% visiting daily and half of visits lasting half a day, 40 hot desks serve 100 members (2.5 per desk) with 3.3% of visits without a desk.
That is a result for the assumptions below, not a recommended ratio for every space. The same case still has visitors without a desk on 11 of 20 days. This article counts those visits even when the visitor stays in the lounge.
Start from the coworking space model (free sign-up; running a simulation requires Pro). It ran the same tools an AI calls over MCP; every figure and number below comes from that run. The office hot-desking article sizes desks for employees; here the desk supply stays fixed while the flexible membership pool grows. Phone booths need their own capacity check.
If everyone stays all day, the free hot desk ratio calculator estimates short-day probability and the largest member pool at your target. No account or AI is needed. Read the binomial method for its assumptions. Its target counts days with any shortage; this article counts visits without a desk and includes part-day desk reuse.
Which seats are available?
The model has 40 hot desks and 8 dedicated desks, a lounge and kitchen, 4 phone booths, 3 meeting rooms and 4 private offices. Only the chairs tagged as hot desks are available to these flexible members. Dedicated members and office tenants are excluded; their seats and the meeting rooms do not provide extra desk capacity.
The tools read the original floor with get_space and report 0 issues with check_space. The furniture stays as drawn.
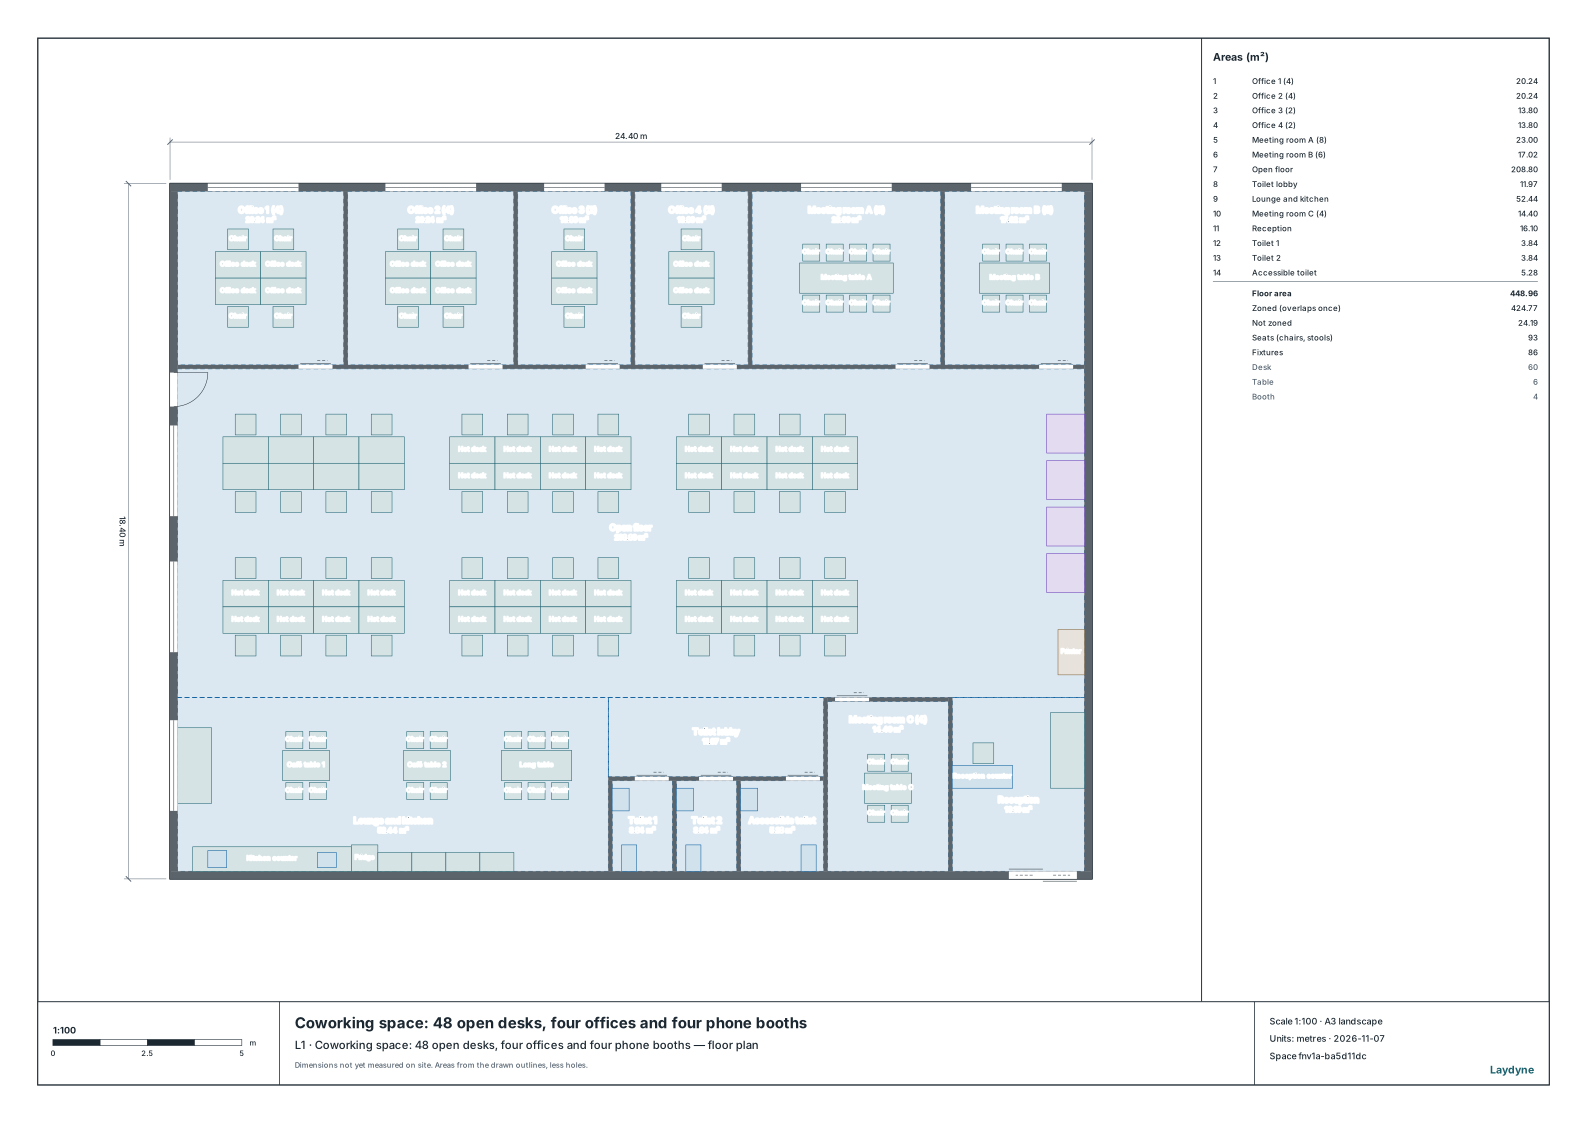
The upper-left desk island on the open floor contains the dedicated desks; the other desk islands on that floor are hot desks.
A day of flexible visits
All arrival times, stay lengths, shares and the service threshold below are assumptions, not measured coworking demand.
- Each member independently has a 50% chance of visiting on a day. Each visitor makes a single visit.
- In the main case, 50% of visits are full days and 50% are half days. Half-day visitors are equally likely to choose morning or afternoon.
- Full-day and morning visitors arrive between 8:00 and 10:00, most often at 9:00. Afternoon visitors arrive between 12:00 and 14:00, most often at 13:00.
- Full-day visitors stay for 6 to 8 hours, most often 7; half-day visitors stay for 2 to 4 hours, most often 3. Arrival times and stays use triangular distributions.
- On arrival, the member takes the nearest free hot desk (
pick: free) and holds it for the visit. The desk becomes available when they leave it. A member keeps the desk throughout the stay; breaks and trips to booths are not simulated. - If no desk is free, the visitor goes straight to the lounge for the same planned stay. There is no queue or later retry. This is a visit without a desk, also called a desk turn-away here; it does not mean the visitor left the building. The lounge is an overflow destination, not a separately sized supply of workstations.
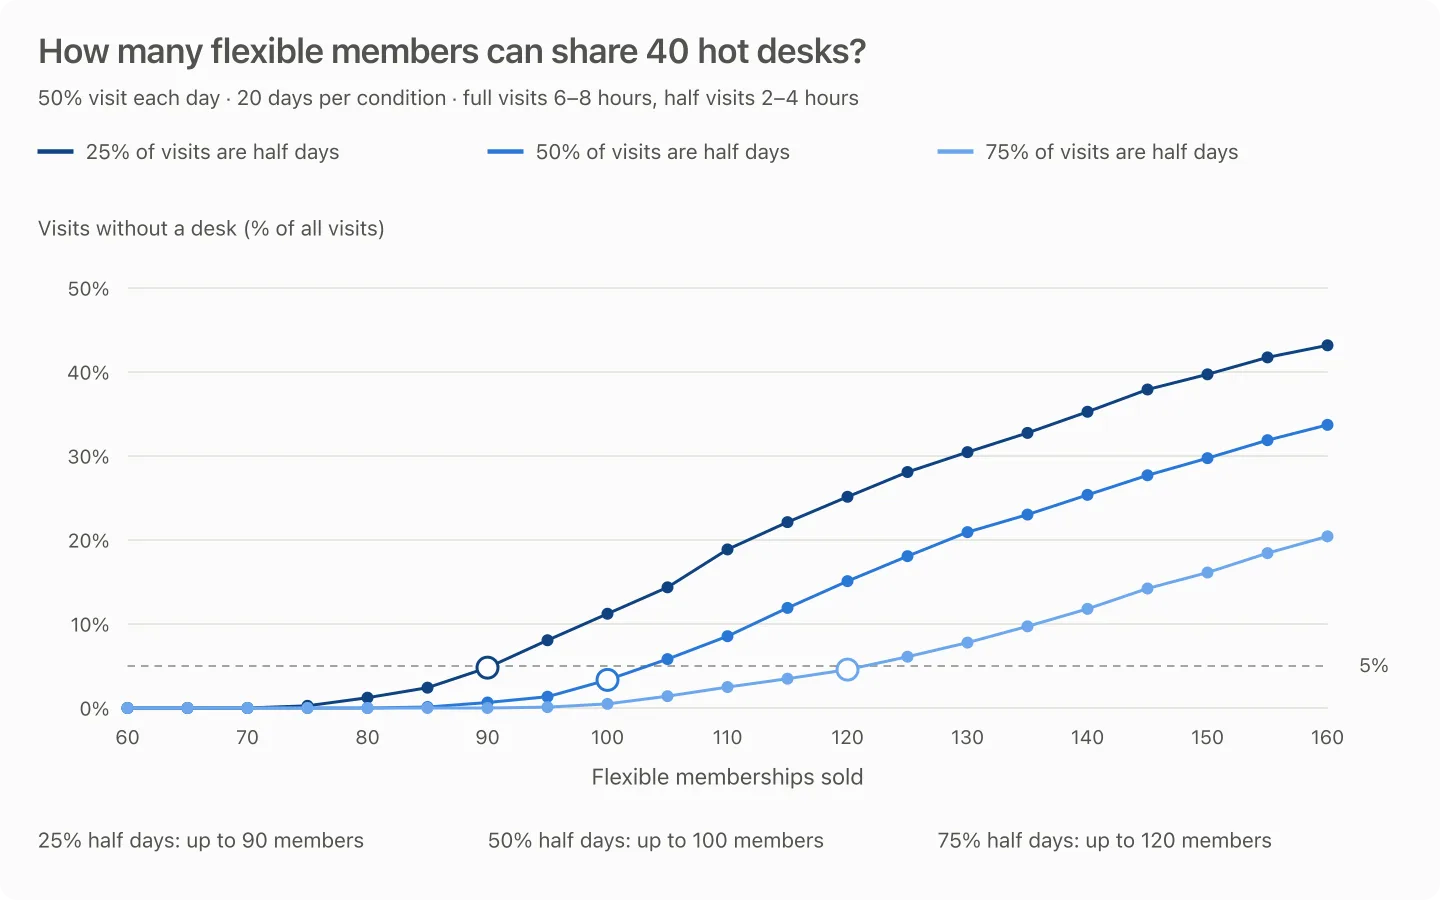
The scenario is saved with put_process_scenario. Each condition runs for 20 days with run_process_scenario: 60 to 160 members in steps of 5, with 25%, 50% or 75% of visits lasting half a day. Each run covers 8:00 to 20:00, and everyone finishes and leaves before the end on every day.
The daily values (perRun) count visits, visits without a desk and completed departures. Peak desks in use is the most hot desks taken at once on each day. A desk counts as taken from the moment a member heads for it until they leave it.
More memberships, the same desks
The target is fewer than 5% of all visits without a desk across the 20 days. It is an assumed service choice, not an industry standard. Divide all desk turn-aways by all visits; do not average the daily percentages.
| Flexible members | Visits/day | Seated visits/day | Peak desks in use, mean / maximum | Visits without a desk/day (share) | Worst day's share | Days with any desk turn-away |
|---|---|---|---|---|---|---|
| 80 | 40.7 | 40.7 | 32.1 / 39 | 0.0 (0.0%) | 0.0% | 0 |
| 90 | 45.8 | 45.5 | 35.8 / 40 | 0.3 (0.7%) | 9.3% | 2 |
| 100 | 50.8 | 49.1 | 38.6 / 40 | 1.7 (3.3%) | 15.5% | 11 |
| 105 | 53.3 | 50.2 | 39.2 / 40 | 3.1 (5.8%) | 18.3% | 13 |
| 120 | 61.3 | 52.0 | 40.0 / 40 | 9.3 (15.1%) | 26.9% | 19 |
Daily means over 20 days, with 50% daily attendance and 50% half-day visits. Peak maximum is the largest simultaneous desk use on any day. Worst day's share is that day's desk turn-aways divided by that day's visits.
The largest tested count below the target is 100 members; the next tested count, 105, leaves 5.8% of visits without a desk. The search uses steps of 5 members, so it does not locate the boundary between those counts.
At 100 members, 49.1 visitors a day get a desk even though only 40 desks exist: morning departures free seats for later visitors. Yet the worst day has 9 of 58 visits without a desk (15.5%), and 11 of the 20 days have at least one desk turn-away. An acceptable overall share can still mean frequent complaints.
Shorter visits allow more memberships
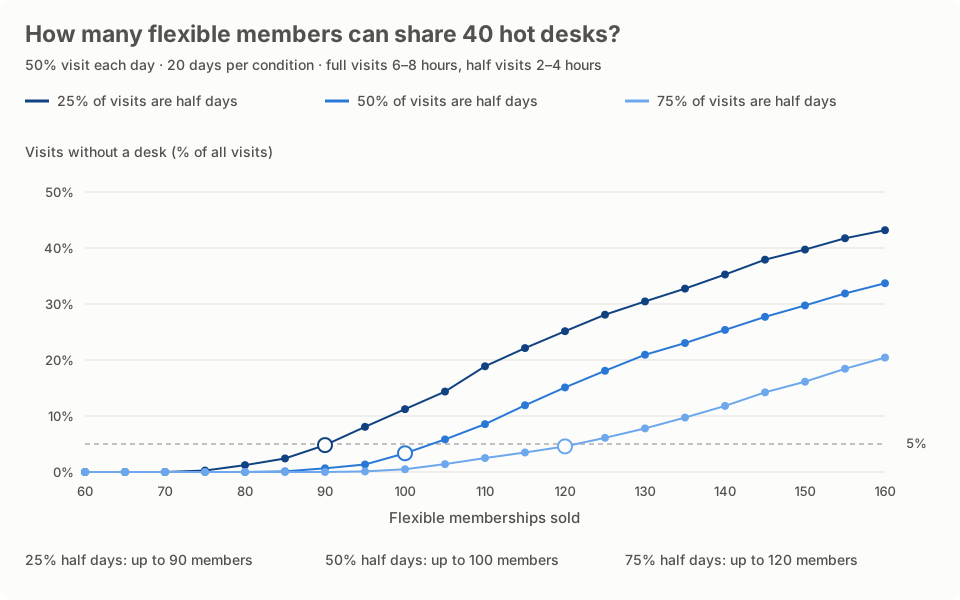
| Half-day share of visits | Largest tested member count below 5% | Members per desk | Visits without a desk | Worst day | Days with any desk turn-away |
|---|---|---|---|---|---|
| 25% | 90 | 2.3 | 4.8% | 18.5% | 11 |
| 50% | 100 | 2.5 | 3.3% | 15.5% | 11 |
| 75% | 120 | 3.0 | 4.6% | 15.4% | 10 |
At the next tested counts, 95, 105 and 125 members, the shares without a desk are 8.1%, 5.8% and 6.1%, respectively. The next count fails the threshold in every case.
With 75% half-day visits and 120 members, the desks serve 58.5 seated visits a day on average. The worst day still leaves 10 of 65 visits without a desk (15.4%). More turnover does not remove the morning peak: full-day and morning visitors overlap before the afternoon group arrives.
For a stricter observed target of no desk turn-aways on any of the 20 days, the largest tested counts are 70, 80 and 90 members at 25%, 50% and 75% half-day visits. Those runs had no failures; they do not establish a zero risk for future days.
What about a typical members-per-desk ratio?
Deskmag's survey article reported an average of 1.2 members per desk in 2018, calculated by averaging the ratios of individual coworking spaces. The operator KAPTÁR also cites that ratio. Deskmag discusses private offices as part of the finding, so this is a historical whole-space observation, not a sales limit for hot-desk memberships alone. It supplies none of this scenario's attendance or stay assumptions.
Before selling more memberships
Use check-ins and check-outs to estimate attendance, arrivals and stay lengths. Separate flexible members from dedicated members, office tenants, day-pass users and guests. Replace the assumptions with your busiest recurring pattern and decide whether your service promise concerns visits, bad days or a guaranteed desk.
The model leaves out correlated team visits, weekday peaks, bookings, guests, desk preferences, cleaning time and lounge crowding. It treats each member's visit decision independently. Sales that meet an overall target in these simulated days can still be uncomfortable on a shared busy morning. This is a desk-availability calculation, not a building occupancy limit.
How to ask an AI
On this coworking floor, keep 40 hot desks and exclude the 8 dedicated desks. Test 60 to 160 flexible members in steps of 5, with 50% visiting each day. Compare 25%, 50% and 75% half-day visits, using the arrival and stay assumptions above. Run 20 days per case. Count visits that find no desk and go to the lounge, peak desks in use, the worst day and days with any desk turn-away. Which tested membership count keeps fewer than 5% of visits without a desk?