Retail & venues / WORKED EXAMPLE
Saturday checkout
See where Saturday shoppers wait: the staffed lanes or the self-checkout pod.
Free to open, edit and save a file. Pro to run your changes. Opening a project asks before replacing your current space.
Does steering shoppers to self-checkout, or faster scanning, shorten the Saturday queue, or only move it?
- Who uses it
- Supermarket managers and front-end (checkout) supervisors
- How it can create value
- Compare self-checkout shares and scanning times before changing the cashier schedule or buying kiosks, and see where the queue goes. Weigh each wait reduction against staff hours and kiosk cost; shorter queues alone do not establish extra sales.
- Bring your site data
- Arrivals by time of day, measured scanning, payment and bagging times, the share of shoppers who use self-checkout and the lanes staffed by hour. How shoppers really choose lanes, balk or switch needs observation before trusting queue lengths.
01 / SETUP
A model you can inspect.
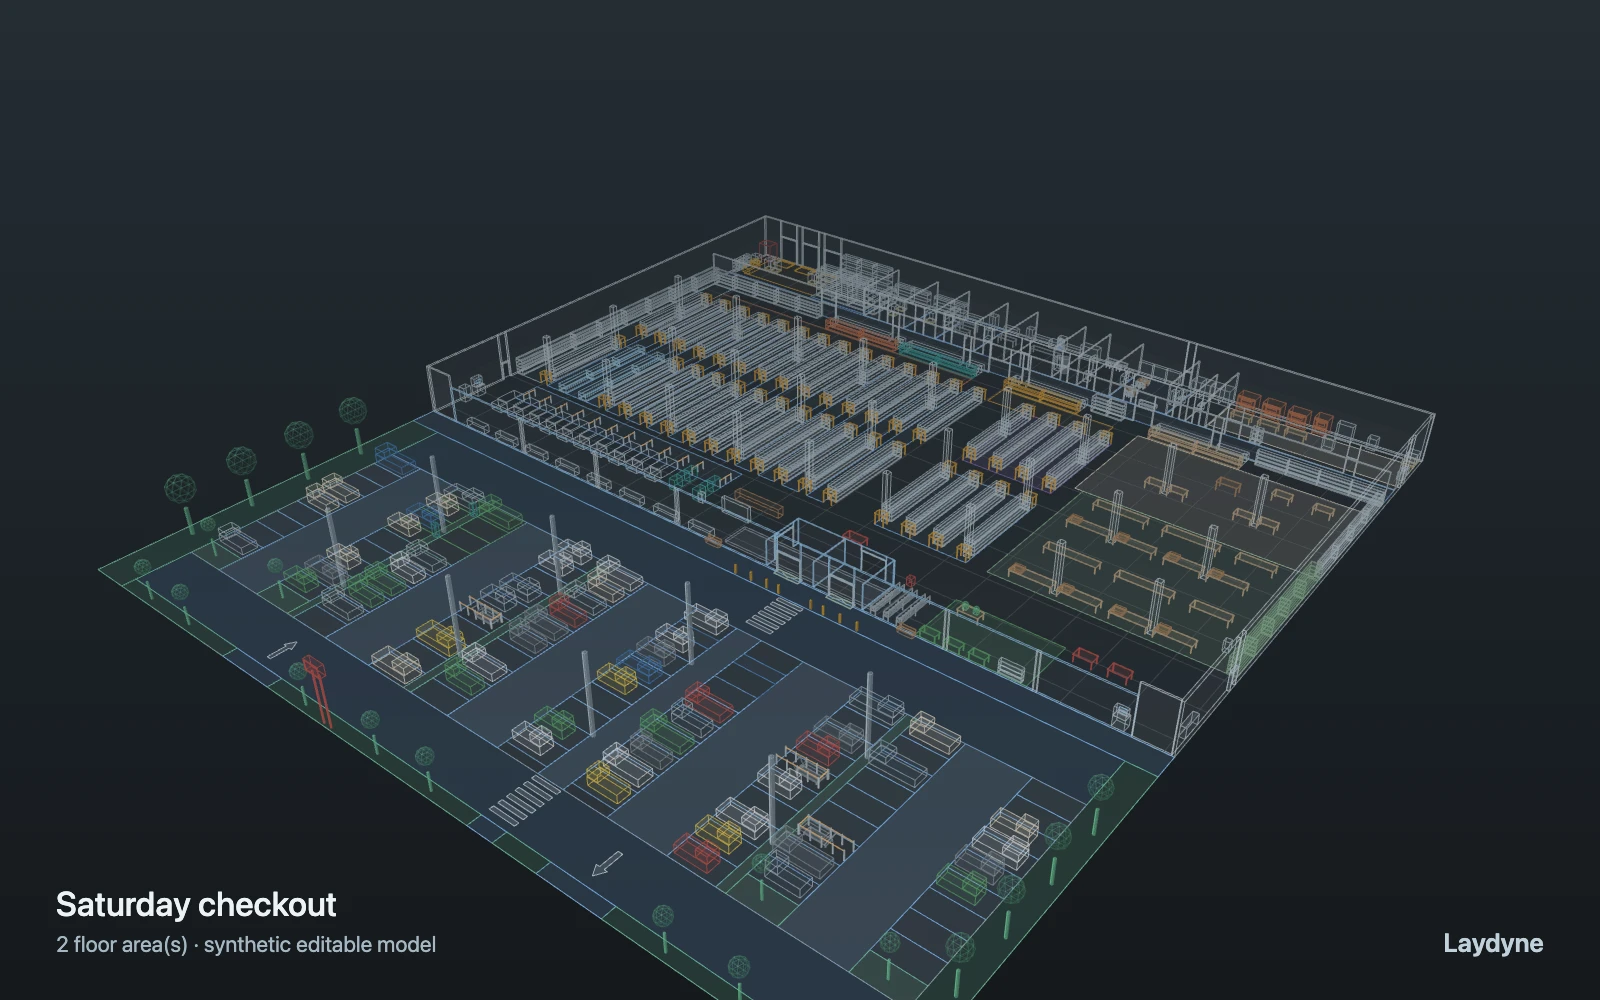
Shoppers arrive at parked cars (poisson, 300 per hour for 36 minutes), walk in, visit 1–2 fresh departments and 2–4 aisles, then either take a free one of eight staffed lanes (counting shoppers already walking to one; in turn when several are free, else the lane with the fewest ahead, judged from the front aisle) or join the single line of the six-kiosk self-checkout pod, and walk back to the car they came in with their bags; a stock clerk brings three pallets to the aisles. Walking, service times and FIFO queues only: no crowd physics, balking, lane switching or sales.
Change one thing
With the same shoppers, move the shares from 70/30 to 60/40 and 50/50, or cut the mean scanning time from 90 to 60 s.
Read the consequence
The queue at each lane and at the pod, mean wait and visit time: watch whether the queue shrinks or only moves to the pod. Purchases, balking, lane switching and physical crowding are not modelled.
View the starting inputs
- Shoppers per hour
- 300
- Share choosing staffed lanes (weight)
- 70
- Share choosing self-checkout (weight)
- 30
- Mean scanning time at a staffed lane (s)
- 90
Agent counts, routes and resource definitions are also saved in the project JSON.
02 / ACTUAL ENGINE OUTPUT
A reproducible starting result.
One run, seed 11. Observation window 60 minutes.
| Scenario | Completed | Mean wait | Mean cycle | Blocked |
|---|---|---|---|---|
| Original scenario | 193 | 57s | 13m 51s | 0 |
Waiting averages cover arrived jobs, including unfinished waits; cycle averages cover completed jobs only. These are synthetic calculations, not measured store performance, revenue or a safety assessment.
Engine, status and output notes
process-des-2.2.0. Status: Original scenario: completed. “Completed” is the engine run status; check the blocked column for unreachable jobs.
- No engine warnings.
Engine inputs and saved comparisons stay with the downloaded project. Any limited trace affects playback details, not aggregate metrics.
03 / MAKE IT YOURS
Plan in 2D. Inspect in 3D. Keep the whole project.
- Open and adjust. Switch between 2D and 3D; edit a part, a floor or an input. Both views describe the same model.
- Connect your agent for free. Sign in, choose Connect AI and connect Codex or Claude Code. Ask it to inspect the example, edit the layout and check a route.
- Save a checkpoint. Export → Project JSON, or ask the agent to export the complete project. Import it later to restore floors, scenarios, saved comparisons and the selected view.
- Compare with Pro. Run an edited scenario or compare frozen options under the same demand. Pro also adds built-in AI and manual cloud saving.