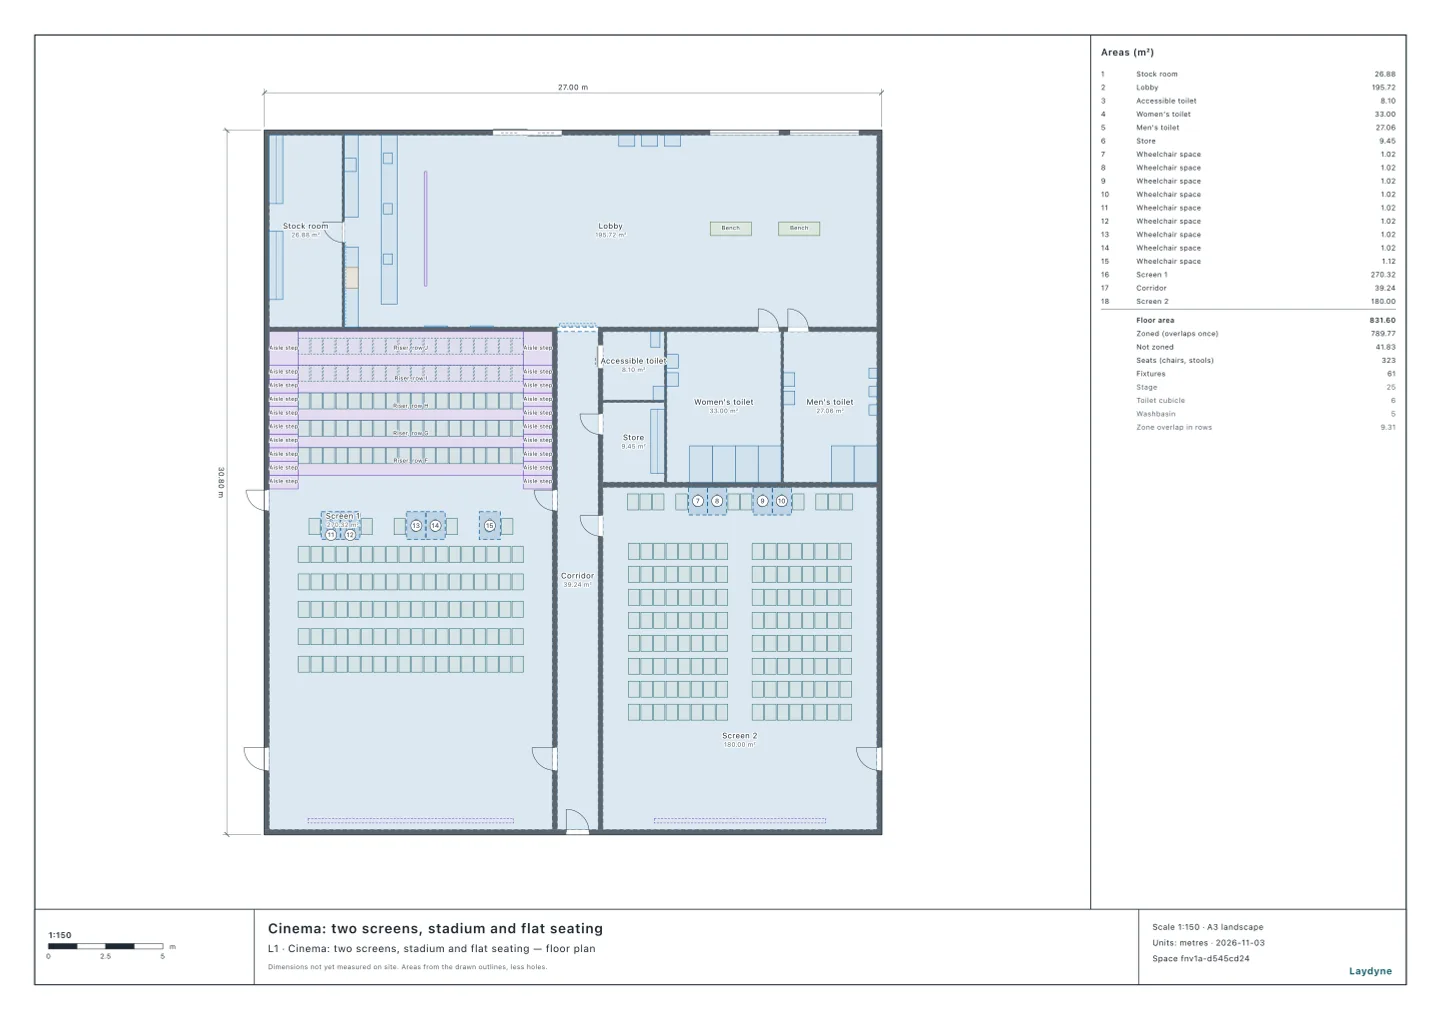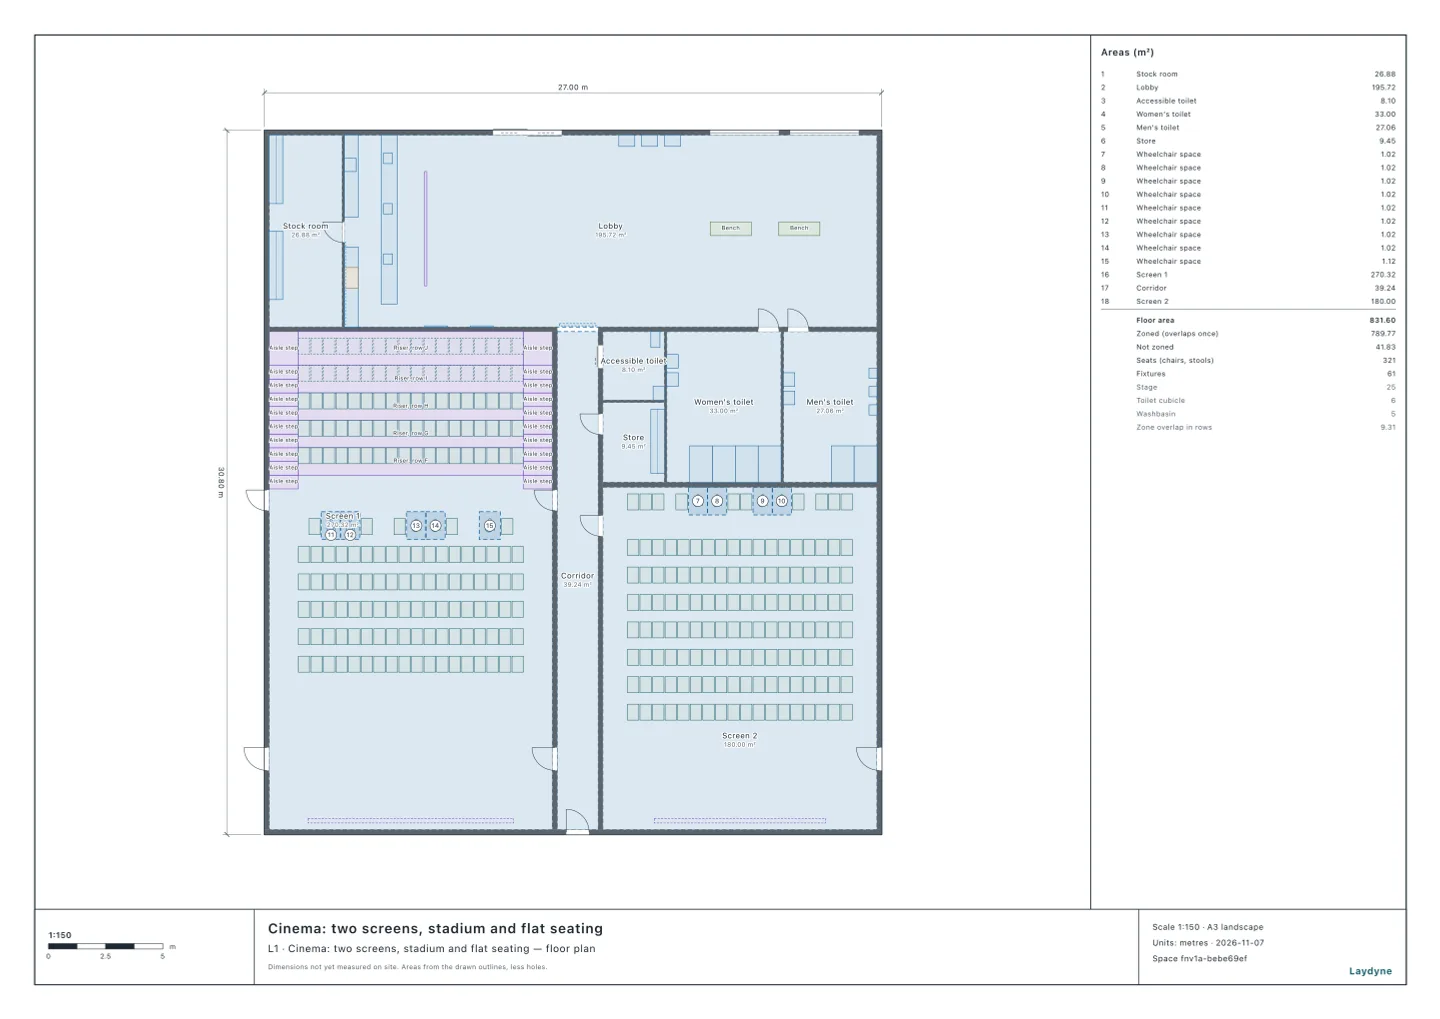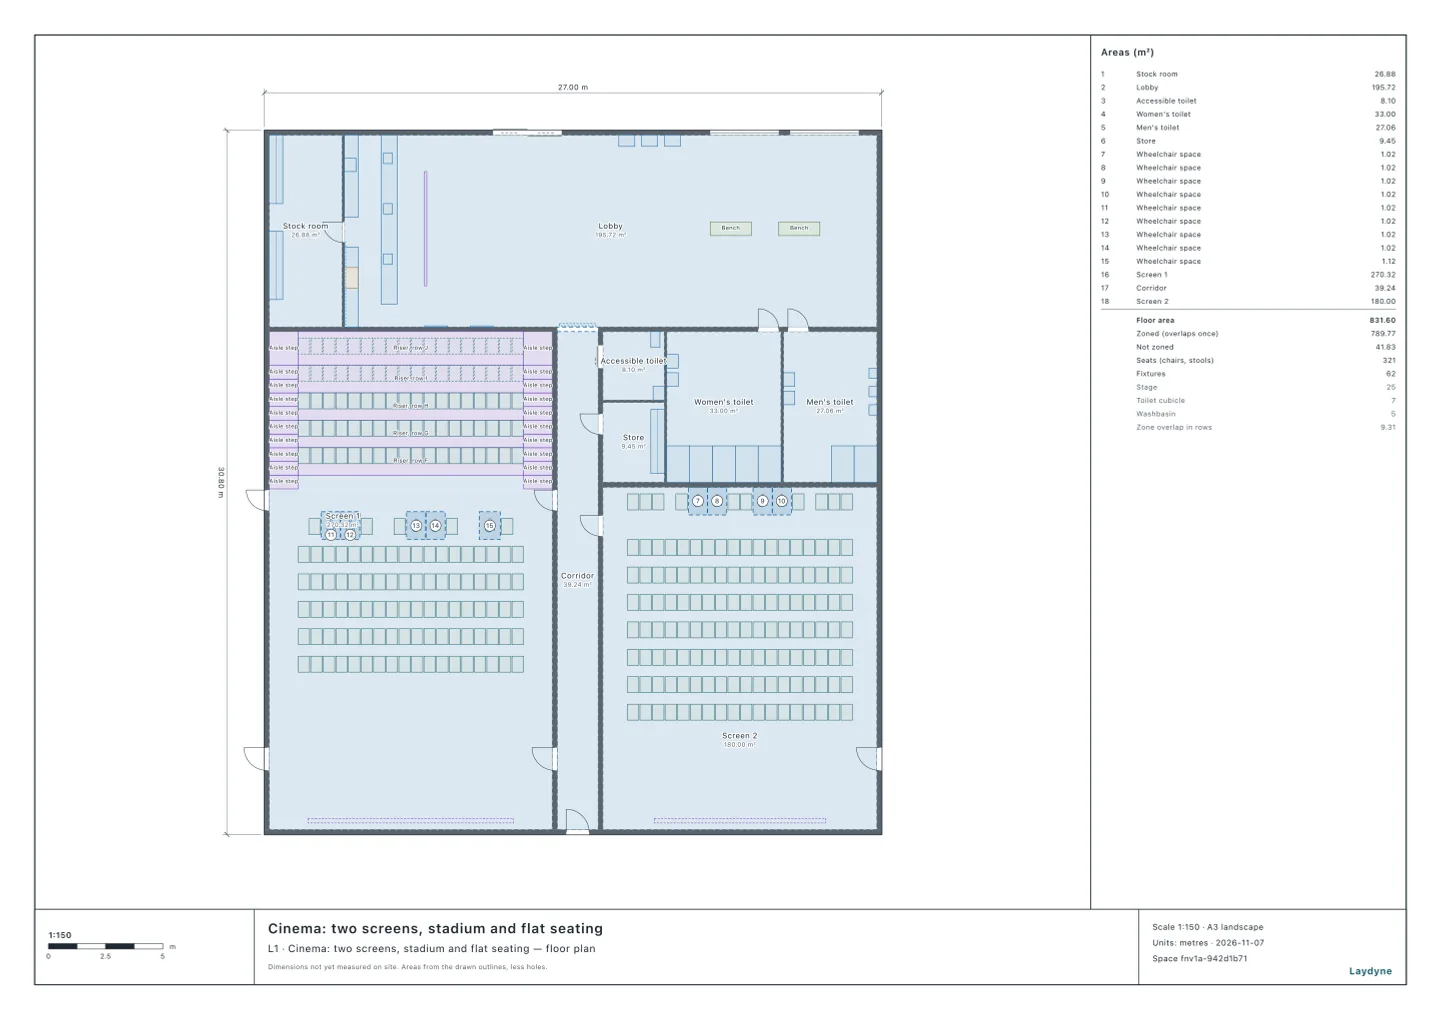
For this 321-person audience, ending the shows 20 minutes apart cuts the women's mean cubicle wait from 15.9 to 7.9 minutes.
For steady arrivals into one shared line, try the free queue wait time calculator to estimate waits and the number of counters for a target average wait. No account is needed. Its Erlang C assumptions do not cover the bursts, separate lines or walking in a simulation; running simulations in Laydyne requires Pro.
That is a large improvement, but a long wait remains. A cinema operator can change the end times as well as the fixtures. The useful question is how much of the rush from one screen is still waiting when the next audience arrives.
Open the cinema model (free sign-up), or use your own plan. This is the model used in the seating and sightlines articles. Here the seats and screens stay in place. It ran the same tools an AI calls over MCP, on copies of the model; every figure and number below comes from that run.
The audience and the toilets
get_space reads 185 seats in Screen 1 and 136 in Screen 2. For this scenario all 321 seats are occupied; the 5 and 4 wheelchair spaces are unoccupied. Wheelchair users and the accessible toilet need a separate demand scenario, rather than being treated as spare capacity for these queues.
The women's toilet has 4 cubicles and 2 basins. The men's has 2 cubicles, 3 urinals and 2 basins. The accessible room off the corridor has 1 toilet and 1 basin; neither is used in this simulation. The shared toilets open off the lobby, so both audiences use them.
The AI tags the fixtures in one edit_space change, then saves a scenario with put_process_scenario. These operating inputs are assumptions, not measured cinema behavior:
- Screen 1 finishes at time 0. Screen 2 finishes 0, 10 or 20 minutes later. After each ending, people start walking at a uniformly random time within 0–120 seconds.
- Each person has a 50% chance of being assigned to the women's flow. Of those women, 40% visit the toilet; of the men, 30% do. The other people leave directly.
- Of the men visiting, 85% use a urinal and the rest a cubicle. The fixture times below use triangular distributions: a minimum, a most likely time and a maximum.
| Fixture | Minimum (s) | Most likely (s) | Maximum (s) |
|---|---|---|---|
| Women's cubicle | 60 | 90 | 240 |
| Men's cubicle | 120 | 180 | 360 |
| Urinal | 30 | 40 | 75 |
| Basin, either toilet | 10 | 15 | 30 |
Everyone who uses a toilet then queues for a basin, washes, and leaves through the main entrance. People walk at an assumed 1.1 m/s. They start at walkable points within their auditorium, not at individual seats: the calculation does not model shuffling along rows or descending the stadium steps. It follows routes through the plan, with first-come, first-served fixture queues. Waiting people share a point; crowd pressure, a queue's floor area and congestion at doors are not simulated. This is a service-queue comparison, not an evacuation-time assessment.
End together, or separate the endings?
sweep_process_parameters runs each condition 20 times, with seeds 1–20. The same person keeps their random choices across conditions. There are, on average, 64.5 women visiting, 40.6 men using urinals and 7.3 men using cubicles per run. The run lasts 60 minutes from the first ending, and all 321 people leave in every run.
Each wait is for that fixture, including visits with no wait, averaged within a run and then across runs. Longest wait and longest queue mean the averages of the individual runs' maxima, not the worst person or queue across all runs. That is why a queue can have a fractional value. The exit times are also averages of each run's last departure.
| Gap between endings (min) | Women's cubicles | Mean wait (min) | Longest wait (min) | Longest queue (people) | Last out after first ending (min) | Last out after second ending (min) |
|---|---|---|---|---|---|---|
| 0 | 4 | 15.9 | 32.6 | 59.0 | 38.4 | 38.4 |
| 10 | 4 | 11.7 | 22.8 | 41.2 | 38.4 | 28.4 |
| 20 | 4 | 7.9 | 17.8 | 32.9 | 39.0 | 19.0 |
| 0 | 5 | 12.4 | 25.4 | 57.8 | 31.7 | 31.7 |
With the original 4 cubicles, a 10-minute gap cuts the women's mean wait to 11.7 minutes; a 20-minute gap brings it to 7.9 minutes. Even with that longer gap, the longest wait averages 17.8 minutes. Staggering helps, but this assumed rush is still too large to promise a short queue.
The last departure is 39.0 minutes after the first ending with the 20-minute gap, compared with 38.4 minutes when both end together. The later second ending reduces the overlap, but it also moves part of the demand later. Do not read a shorter individual wait as an earlier time to close the lobby.
What happens in the men's toilet?
Men's waits are shown separately for the urinals and cubicles: a short urinal queue cannot stand in for the experience of someone who needs a cubicle. The table uses the original fixtures.
| Gap (min) | Urinal mean wait (min) | Urinal longest wait (min) | Urinal longest queue | Cubicle mean wait (min) | Cubicle longest wait (min) | Cubicle longest queue |
|---|---|---|---|---|---|---|
| 0 | 4.4 | 9.1 | 32.0 | 4.3 | 9.2 | 5.3 |
| 10 | 1.7 | 4.0 | 14.6 | 2.6 | 6.0 | 3.3 |
| 20 | 1.7 | 4.0 | 14.6 | 2.1 | 5.9 | 3.2 |
The 10-minute gap already separates the urinal rushes in these runs. Increasing it to 20 minutes leaves the urinal mean at 1.7 minutes, while the men's cubicle mean falls from 2.6 to 2.1 minutes. Adding a women's cubicle does not change the men's results for simultaneous endings.
The basins are included as limited resources, not as an unlimited handwashing delay. With simultaneous endings, mean basin waits are 0.3 seconds for women and 2.0 seconds for men; the longest waits average 10.3 and 16.7 seconds. They are not the main bottleneck under these assumptions.
A fifth women's cubicle
On a comparison copy, one edit_space change adds a 1.0 × 1.6 m cubicle, 2.0 m high, beside the women's existing row. It faces the same way, stays within the room and leaves the entrance and basins in place. check_space reports 0 issues before and after the addition. That checks the drawn layout; it is not a plumbing or accessibility approval.
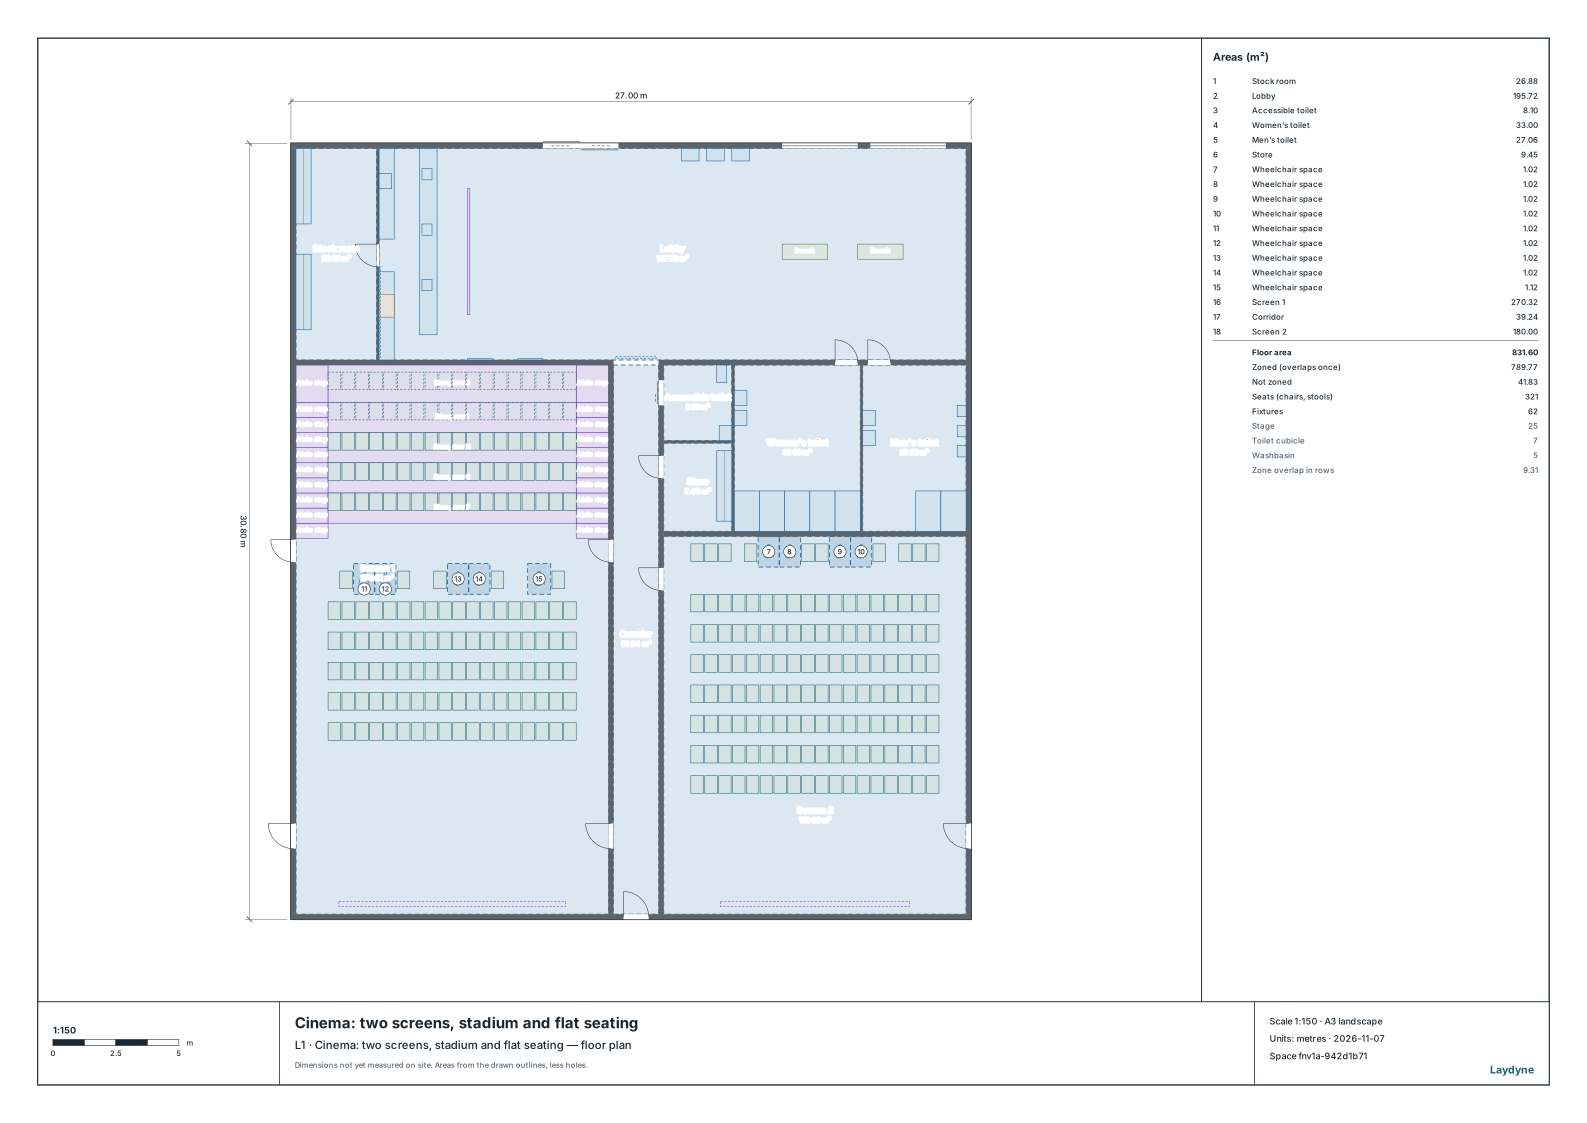
With simultaneous endings, that fifth cubicle reduces the women's mean wait from 15.9 to 12.4 minutes and the longest wait from 32.6 to 25.4 minutes. The last person leaves after 31.7 minutes. It helps less with individual waits than the 20-minute schedule gap, but clears the combined audience earlier. These are separate alternatives; this comparison has not tested the extra cubicle together with staggered endings.
How does this compare with US fixture minimums?
The International Building Code (IBC) names this table 2902.1; the International Plumbing Code (IPC) counterpart is 403.1. The theater row, Assembly A-1, requires a water closet per 125 men, a water closet per 65 women, and a basin per 200 people of each sex. These ratios appear in the 2021 Seattle Building Code table and the 2025 Plumbing Code of New York State, based on the 2024 IPC. Seattle uses the Uniform Plumbing Code for installation; the IPC comparison here is not a claim about Seattle's substitution rules.
For this audience-only count, include the 321 seats and 9 wheelchair spaces: 330 places, or 165 per sex. Applying the ratios and rounding up gives 3 women's water closets, 2 men's water closets and 1 basin per sex. The model's 4 women's cubicles, 2 men's cubicles and 2 basins per sex meet or exceed those counts without crediting the accessible room. A complete project calculation must include staff and any other applicable occupant loads; changing show times does not lower the required fixture count.
IPC section 424.2 limits urinal substitution to 67% of the required male water closets in assembly and educational occupancies. At a requirement of 2, at most 1 can be replaced, leaving at least 1 water closet. The model already has 2 men's cubicles; its 3 urinals do not need substitution credit. The limit is not a cap on additional urinals. Section 403.1.2 also lets single-user facilities contribute to the count, but this comparison takes no credit for that room. The published New York text prints both provisions in full.
Fixture minimums and a tolerable queue answer different questions. Check the adopted code and amendments for the actual site, then use observed audience mix, toilet take-up and service times to test the schedule. This example excludes staff, people arriving for the next show, cleaning closures, families waiting together and the accessible toilet's users. Those demands can overlap the departing audience.
How to ask an AI
On this cinema plan, keep the audience and fixture times the same and compare film endings 0, 10 and 20 minutes apart, 20 runs each. Then add a fifth women's cubicle on a copy and test simultaneous endings. Report each fixture's mean and longest wait, longest queue, and the last departure from each ending, and confirm everyone leaves.