Add shelves, separate payment from reception, or connect buildings with a bridge: changing a layout or a route can improve some results and worsen others. Here are results from 3 earlier articles in which an AI compared options for the same space. The shop results measure layouts and routes to the same point. The clinic and shopping centre results come from simulations.
1. Results by option
Shop option A is the original layout, and option B adds shelves. Clinic option A shares staff between reception and payment; option B separates their roles and moves the payment window. Its results are means from 20 pairs with the same random inputs, demand and staff count. The shopping centre compares all cinema trips over the bridge with no bridge at all. Its results are means from 20 runs of the same Saturday afternoon for each option, using the same random inputs.
| Place and measure | Option A | Option B |
|---|---|---|
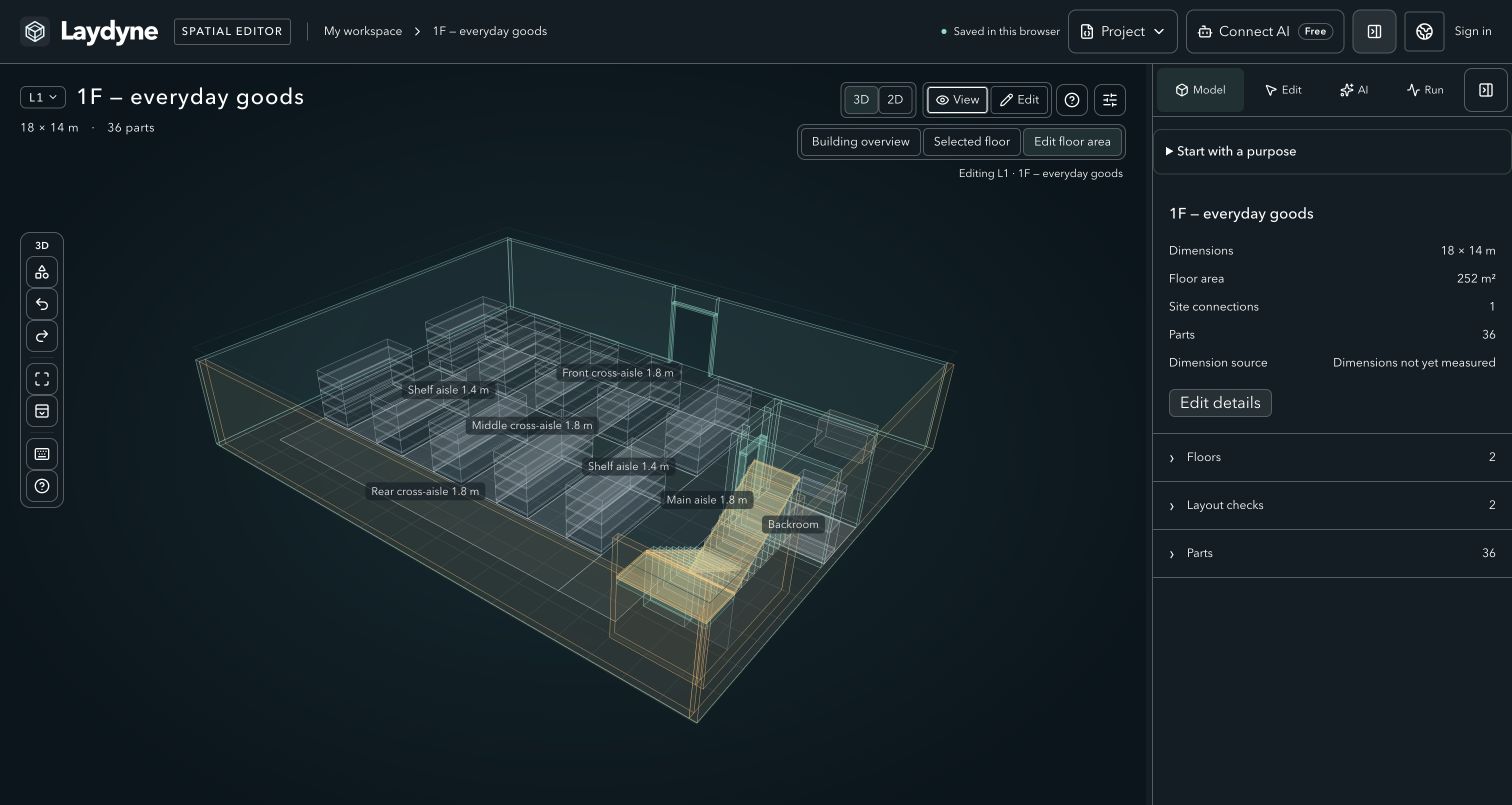
| Shop: shelves across both floors | 12 shelves | 20 shelves |
| Shop: minimum gap between shelves | 4.00 m | 1.40 m |
| Shop: route to the same rear point upstairs | 30.33 m | 30.69 m |
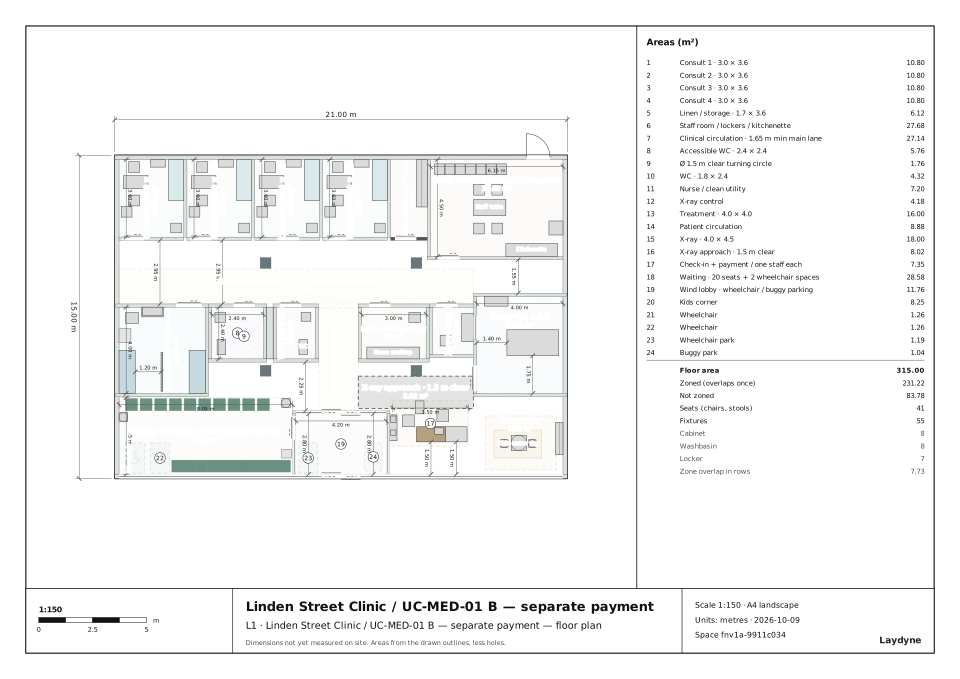
| Clinic: walking distance per arriving patient | 94.76 m | 77.34 m |
| Clinic: mean patient wait | 1,902.16 seconds | 1,922.54 seconds |
| Clinic: wait at the reception step | 18.71 seconds | 122.93 seconds |
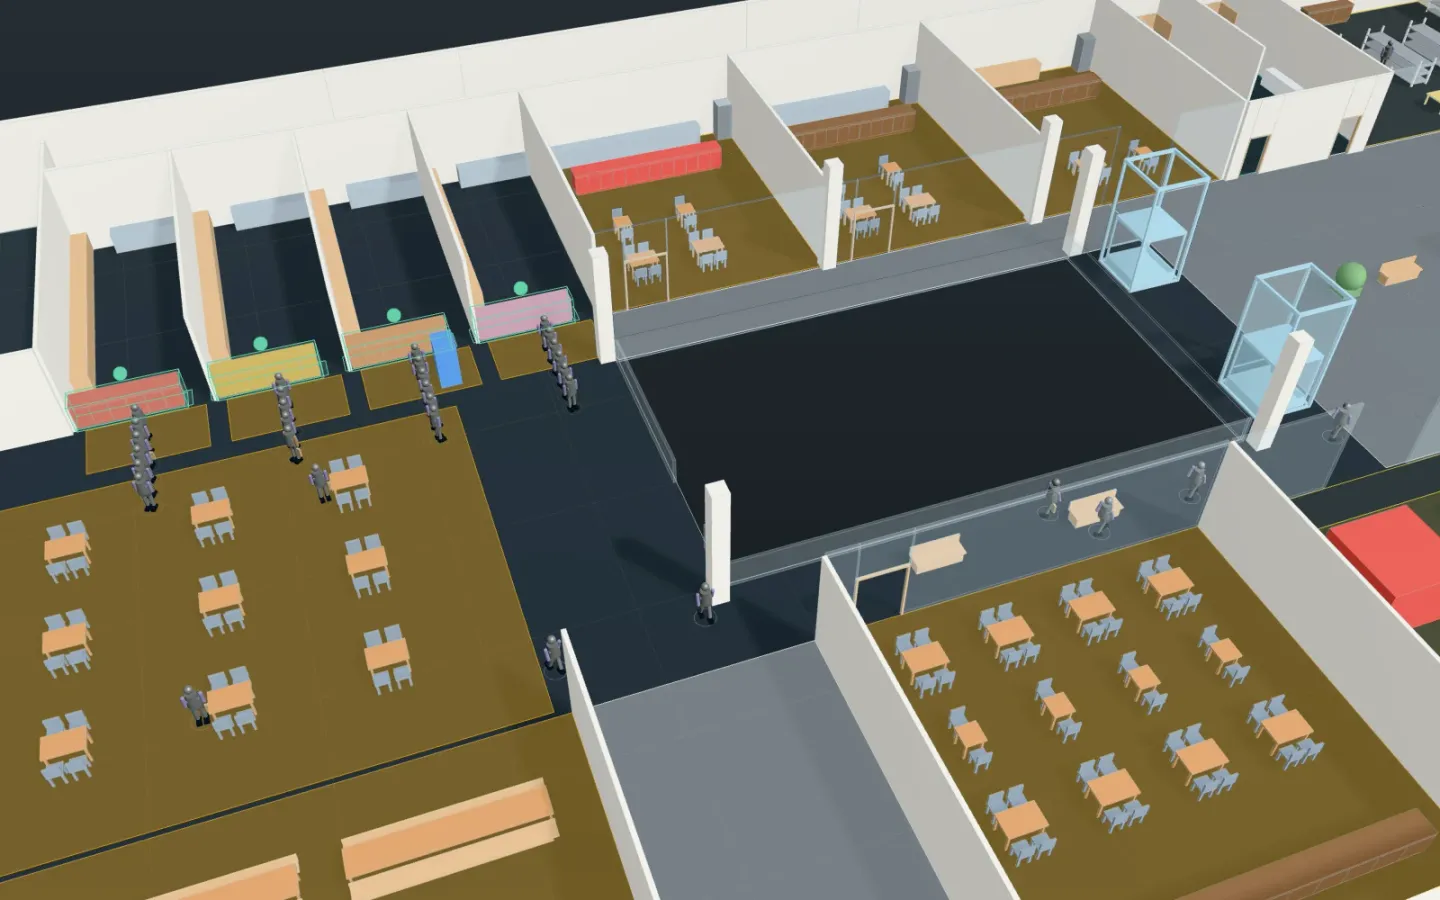
| Shopping centre: most people on the plaza | With bridge: 11.5 people | No bridge: 20.2 people |
| Shopping centre: film-goers from arrival to their seat, including shopping in the main building | With bridge: 10.7 minutes | No bridge: 10.5 minutes |
| Shopping centre: previous audience from leaving the cinema to leaving the site, including meals for those who eat | With bridge: 9.7 minutes | No bridge: 10.8 minutes |
2. What they show
In all 3 examples one measure improved while another worsened: the shop's shelves rose from 12 to 20, but the minimum gap between them narrowed from 4.00 m to 1.40 m.
- Read capacity and clear space together. The shop's shelf count rises from 12 to 20. The minimum gap between shelves narrows from 4.00 m to 1.40 m, and the route to the same rear point upstairs grows from 30.33 m to 30.69 m. This route is a distance to a fixed point, not a customer's mean travel distance.
- Shorter walks can come with longer waits. The clinic's walking distance per arriving patient falls from 94.76 m to 77.34 m. The mean patient wait rises from 1,902.16 seconds to 1,922.54 seconds, and the wait at the reception step rises from 18.71 seconds to 122.93 seconds. Staff roles and the window location change together, so the result cannot be put down to the routes alone.
- Arriving and departing visitors can see different results. Without the bridge, the most people on the plaza rises from 11.5 to 20.2. Film-goers' time falls from 10.7 minutes to 10.5 minutes, while the previous audience's time rises from 9.7 minutes to 10.8 minutes. These times include shopping or meals. The bridge did not make everyone faster.
3. The articles
- How do more shelves change the aisles? A two-storey shop comparison
- Separate payment shortened travel but increased waiting
- Do the buildings need a bridge?
4. How to ask an AI
Compare options for this space. First show which layouts or staff roles change and which conditions stay the same. Compare capacity, clear widths, travel and waiting as needed, and list what improves and what worsens. Separate routes to fixed points from people's mean travel distance. State the assumptions and what you have not checked.
5. What this does not cover
- These results use each article's example space and conditions. They are not measurements of real facilities. Check dimensions, demand and service times against your own facility.
- Customer flow, queues and sales in the shop were not calculated. Reach checks with a circle alone do not establish real wheelchair turning or compliance with evacuation rules.
- The clinic's travel covers patients only, not staff. Shorter walking does not establish a shorter total visit.
- People in the shopping centre walk at fixed speeds and do not slow down in crowds. Escalator capacity is also an assumption. The most people on the plaza is a count, not a density per square metre. The bridge's effect on sales is unknown.